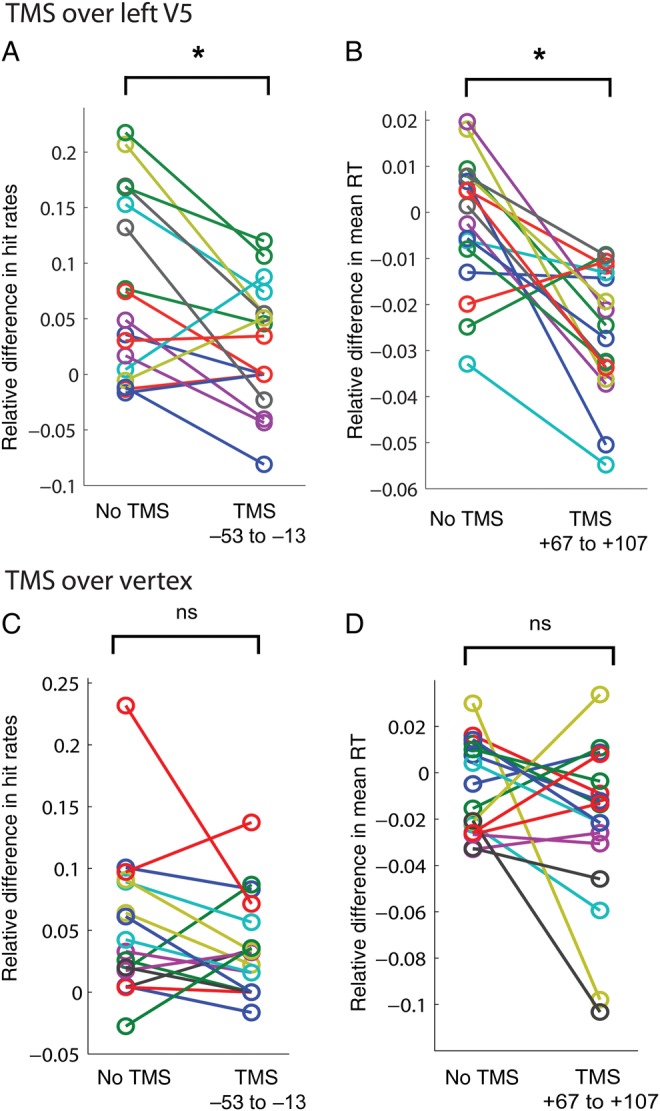
Figure 3.

Individual subject data for the critical time windows. (A) Individual subject data for the significant TMS effect during V5 stimulation, that is, relative hit rate difference in the no-TMS condition and T1. (B) Individual subject data for relative RT difference in the no-TMS condition and T4 during V5 stimulation. (C) Individual subject data for the comparison between no-TMS condition and T1, equivalent to A, for vertex stimulation. (D) Individual subject data for relative RT difference for the no-TMS condition compared with V4, equivalent to B, for TMS over the vertex.
