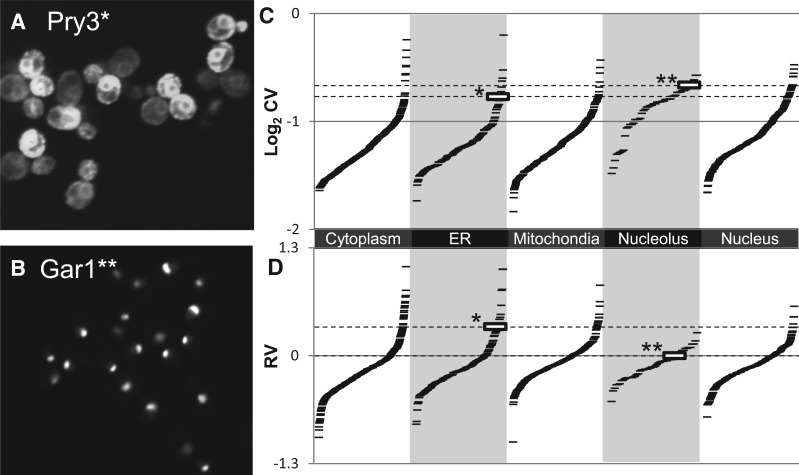
Fig. 2.
Variability in protein abundance. (A) Pry3 shows high cell-to-cell variability in protein abundance. (B) Gar1 shows a nucleolar localization pattern but little cell-to-cell variability in abundance. (C) CVs for nucleolar proteins are systematically biased relative to other localization classes. Each ‘-’ symbol represents the cell-to-cell variability for GFP fluorescence intensity for a single strain (tagged protein) in the collection. Gar1 (indicated by **) shows a higher CV than Pry3 (indicated by *). (D) RV estimates show much less bias between classes. Pry3 (indicated by *) shows a much higher RV than Gar1 (indicated by **). Example cell images are contiguous sections cropped from larger images. Contrast settings for Gar1 were adjusted to highlight the nucleolar pattern

