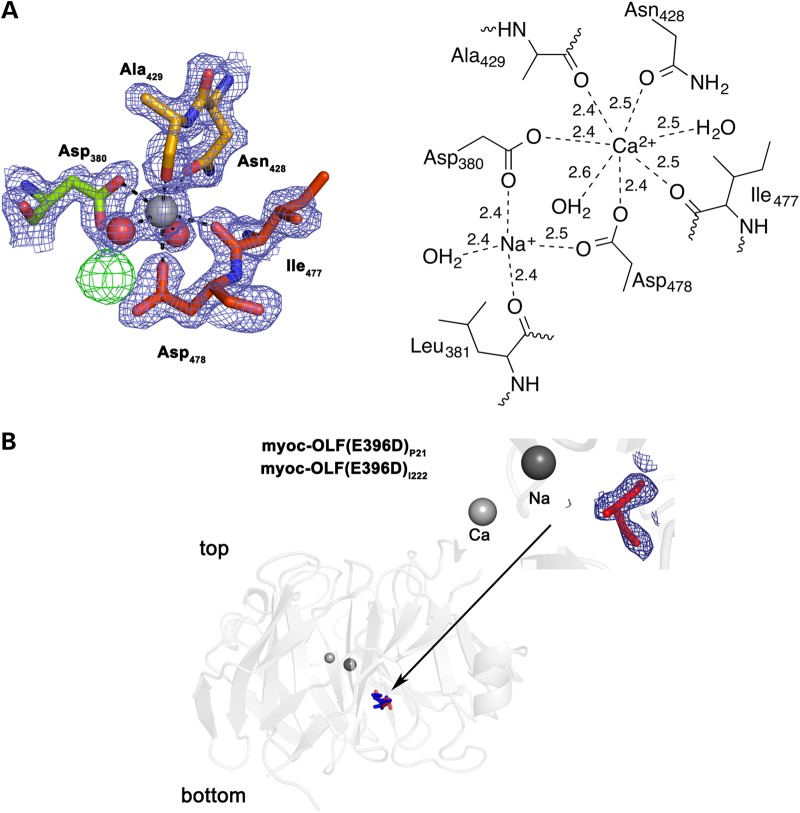
Figure 3.
Details of hydrophilic cavity. (A) Ca2+ site and coordination details. Final 2Fo −Fc electron density (blue) is contoured at 1.5σ and difference Fo −Fc density (green) depicting crystallographic Na+ site is contoured at 3σ (see text). Distances are listed in Å. (B) View of observed glycerol located in the internal hydrophilic cavity, with final 2Fo − Fc electron density for myoc-OLF(E396D)I222 contoured at 1σ.

