Figure 1.

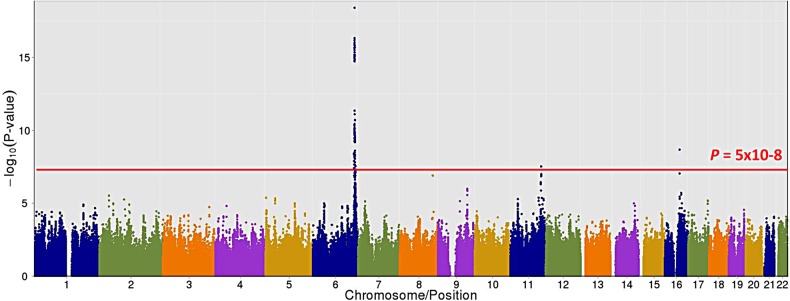
Association results of Lp(a)-cholesterol across all autosomal chromosomes. SNPs are plotted on the x-axis according to their position on each chromosome against association with Lp(a)-cholesterol on the t-axis (shown as –log10 P-value).

Association results of Lp(a)-cholesterol across all autosomal chromosomes. SNPs are plotted on the x-axis according to their position on each chromosome against association with Lp(a)-cholesterol on the t-axis (shown as –log10 P-value).