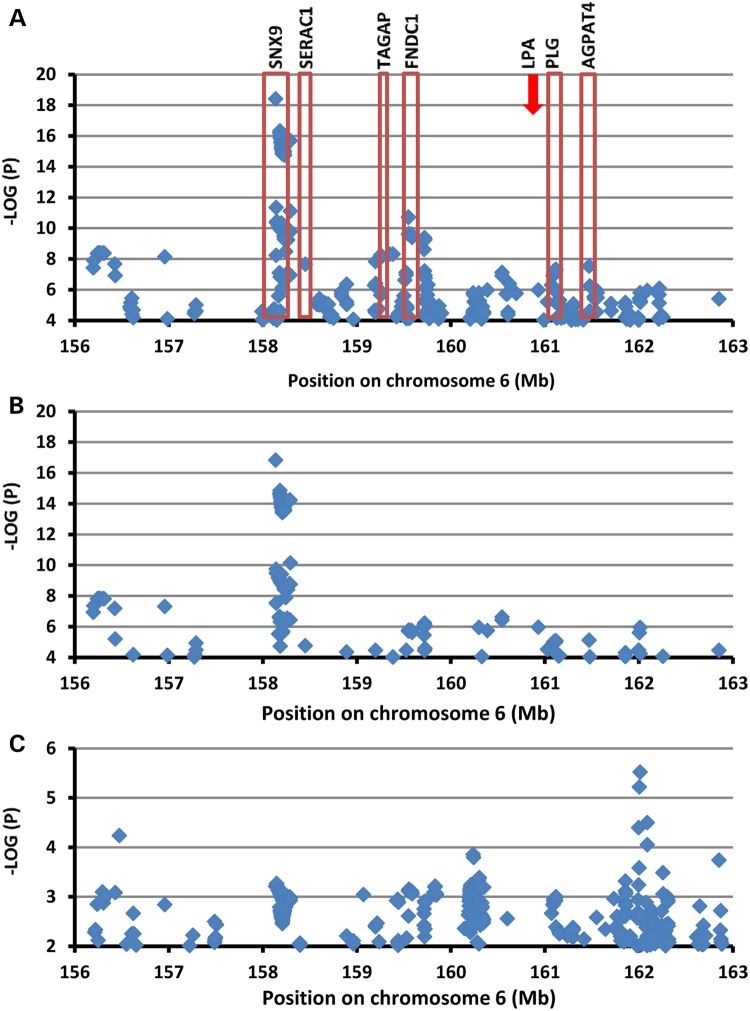
Figure 3.
Association of SNPs on chromosome 6 with Lp(a)-cholesterol levels. SNPs are plotted by position on chromosome 6q25-26 against association with Lp(a)-cholesterol (–log10 P-value). (A) Highlights the most significant SNP in association analysis adjusted age, age2 and sex; (B) The most significant SNP after conditional analysis where included age, age2 sex and KIV-2 numbers as a covariate; (C) The most significant SNP after conditional analysis where included age, age2 sex, KIV-2 numbers, rs3798220 and rs10455872 as a covariate. (Arrow marked LPA location.)

