Figure 9.
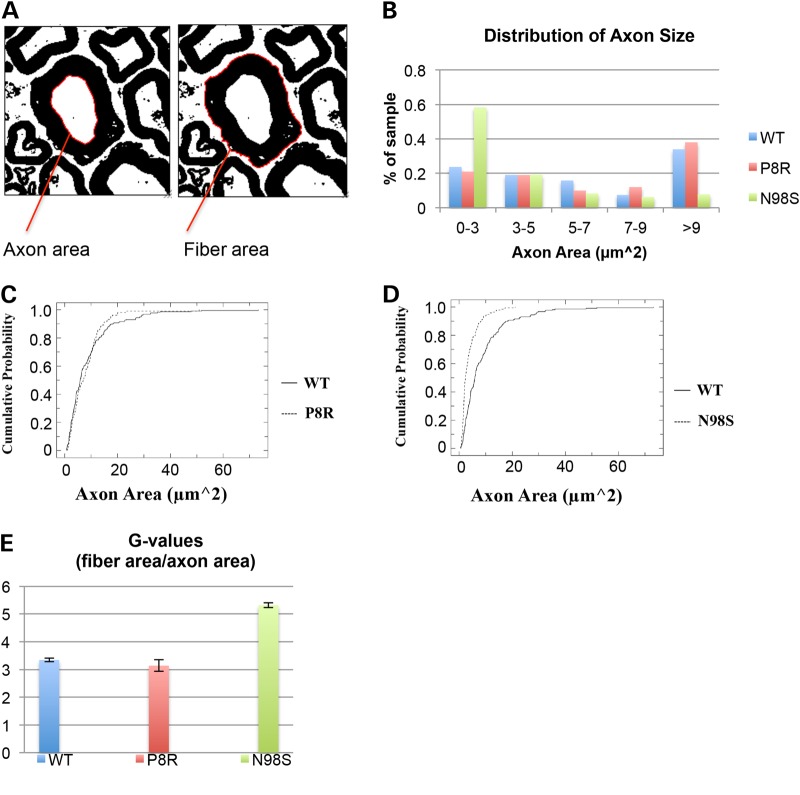
Axon size distribution and g-ratios based on the electron micrographs. (A) G ratio = fiber area/axon area. Axon and fiber areas were measured using the magic wand tool set to scale in ImageJ. (B) Nefl+/+ and NeflP8R/+ mice show similar distribution of axon sizes, with axons >9 µm2 occupying the greatest percentage of the sample measured. NeflN98S/+ mice show a different pattern of axon size distribution, with a greater percentage of axons with smaller areas. (C) Cumulative distribution of axon areas measured in Nefl+/+ and NeflP8R/+ mice. The distributions are not significantly different (Kolmogorov–Smirnov KS test P > 0.05). (D) Cumulative distribution of axon areas measured in Nefl+/+ and NeflN98S/+ mice. The distributions are significantly different (Kolmogorov–Smirnov KS test P < 0.001). (E) Nefl+/+ and NeflP8R/+ mice show similar g-ratios axon sizes. NeflN98S/+ mice show a much higher g-ratio, indicating that there is more myelin on the axons of the NeflN98S/+ mutant mice; Nefl+/+ n = 215, NeflN98S/+ n = 192, and NeflP8R/+ n = 100. Data were pooled from the results from three different mice.

