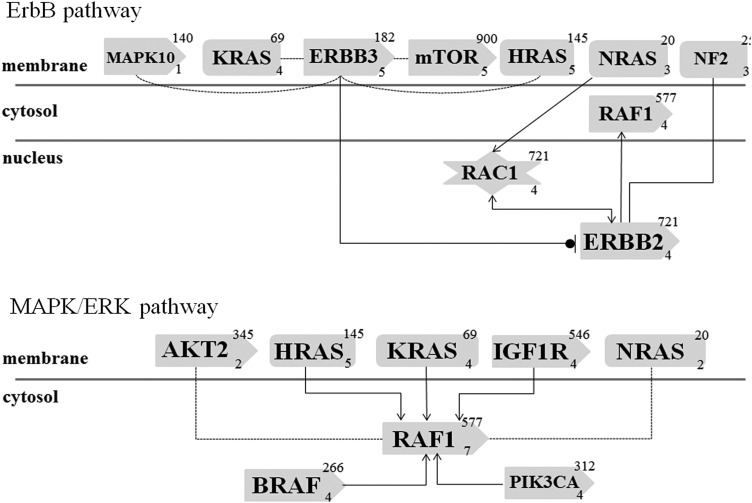
Figure 2.
Simplistic overview of the top two mutation-enriched transduction signaling pathways in ATC as according to the Genomatix Pathway System. The ErbB (top) and MAPK/Erk (bottom) signaling pathways are illustrated with each mutated gene depicted. Gene products are drawn as rounded rectangles, snip-sided rectangles denote proteins with kinase properties and star-shaped symbols denote co-factors. The top right number denotes the number of sources for a chemical association with established molecules (for therapeutic purposes), the lower right number refers to the number of established interactions within the pathway in addition to the drawn association. Filled lines with arrows denote an activating effect; filled lines with stop line and circle denote inhibitory effect. Dotted lines indicate evidence at the level of co-citation, in contrast to filled lines which indicate evidence at expert-curation level.

