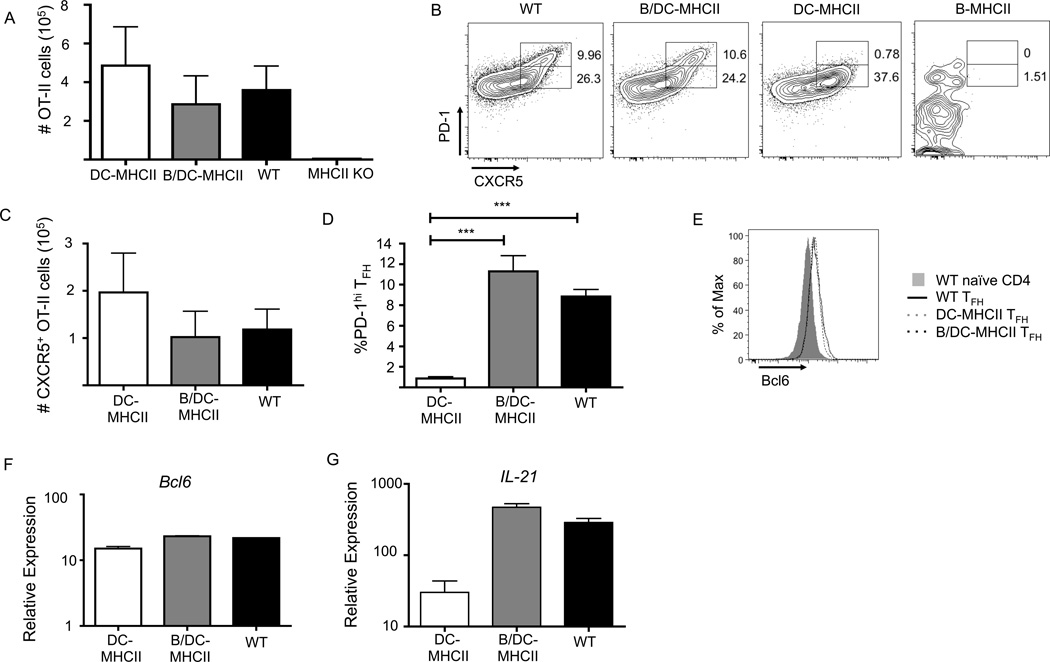
Figure 5.
MHCII antigen presentation by DCs and B cells cooperates for TFH differentiation. 1×10⁵ OT-II cells were transferred to WT, B-MHCII, DC-MHCII and B/DC-MHCII mice. Mice were immunized with NP-OVA in alum i.p. and analyzed on day 7 p.i. (A) Total number of OT-II cells (CD19− TCRβ+CD90.1+) in the spleen on day 7 p.i. (B) Representative FACS plots of OT-II cells for expression of CXCR5 and PD-1 to identify TFH. Numbers represent the percent of OT-II cells that are CXCR5+ PD-1hi and PD-1int (C) Total number of CD62L− CXCR5+ OT-II cells in the spleen on day 7 p.i. (D) Quantification of PD-1hi OT-II TFH from the plots shown in (B) (E) Histogram overlay of Bcl6 expression by CD6L−CXCR5+ OT-II cells. Relative expression of (F) Bcl6 and (G) IL-21 mRNA in sorted CXCR5+ OT-II cells relative to naïve CD4+ T cells. Bar graphs in (A), (C), (D), (F) and (G) show mean ± SEM. n=3–5 mice per group, representative of 3–4 independent experiments. *** denotes a p value of <0.001 calculated using a one way ANOVA with Tukey’s analysis.

