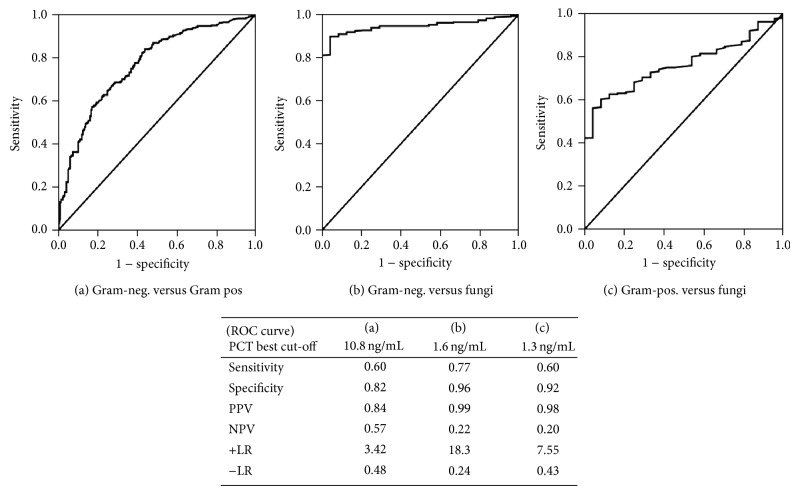
Figure 2.
Receiver operating characteristic (ROC) curves of different cut-offs of PCT in differentiating: (a) Gram-negative bacteria from Gram-positive bacteria (AUC 0.765, 95% CI 0.725–0.805; P < 0.0001); (b) Gram-negative bacteria from fungi (AUC 0.944, 95% CI 0.919–0.969, P < 0.0001); (c) Gram-positive bacteria from fungi (AUC 0.763, 95% CI 0.693–0.832; P < 0.0001). Sensitivity, Specificity, Positive Predictive Value (PPV), Negative Predictive Value (NPV), Positive Likelihood Ratio (+LR), and Negative Likelihood Ratio (−LR) are reported for the best cut-off values found in each ROC.

