Figure 2.

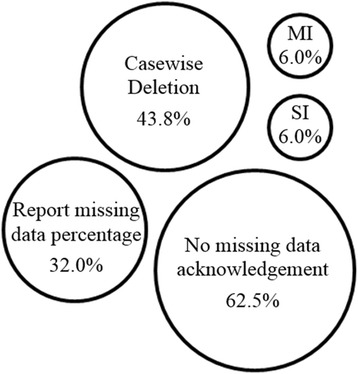
Graphical representation of handling of missing data from the 48 selected studies. MI multiple imputation, SI single imputation.

Graphical representation of handling of missing data from the 48 selected studies. MI multiple imputation, SI single imputation.