
Figure 2.
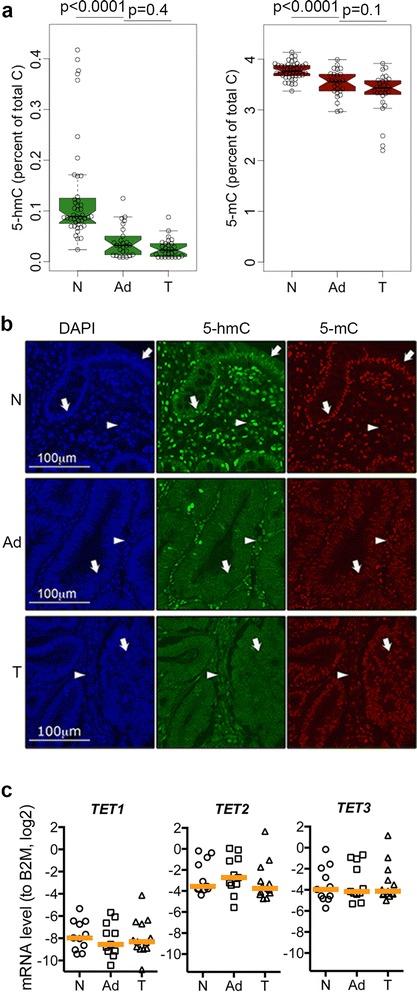
Reduced 5hmC in tumours without global changes in TET s transcripts. (a) Global content of 5hmC and 5mC in normal (N), adenoma (Ad) and adenocarcinoma (T) DNA by mass spectrometry (P values were obtained by a Wilcox test). (b) Representative images from a colon cancer tissue microarray immunofluorescence. Arrows indicate the epithelium, arrowheads the stroma. (c) Absolute levels of TETs (standard curve method) in selected cases from our colon cancer cohort. Orange vertical bands represent the median. Negative values indicate TETs transcripts are less abundant than B2M transcripts. There was no significant change in levels across tissues but considerable variation within tissues.