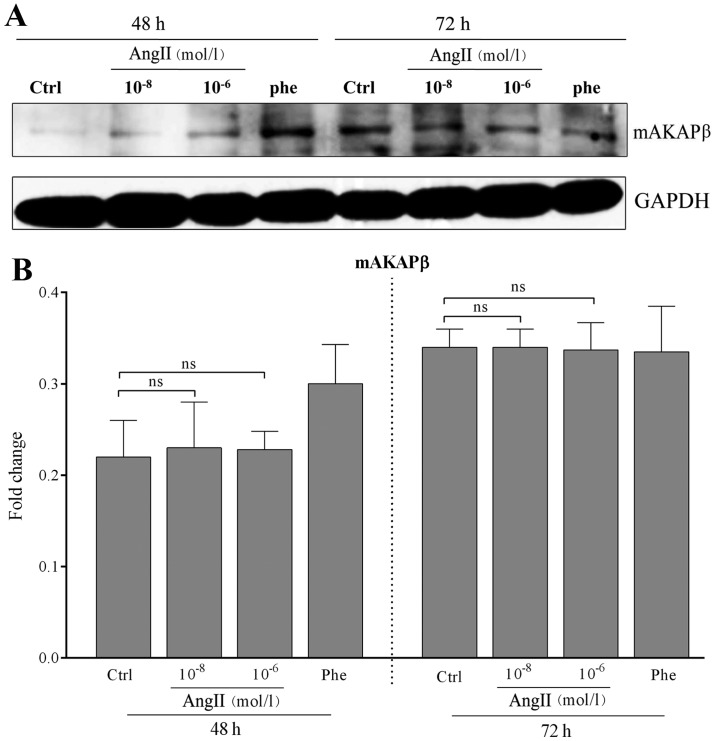
Figure 4.
Expression of mAKAPβ in cardiomyocytes treated with angiotensin II (AngII) at different concentrations and for different periods of time. (A) Representative results of assays of mAKAPβ and GAPDH abundance in cardiomyocytes treated with AngII at different concentrations and different periods of time by western blot analysis. (B) The protein expression levels of mAKAPβ and GAPDH were analyzed by western blot analysis using polyclonal antibodies to mAKAPβ and GAPDH to quantify the expression in these groups. No statistically significant differences were observed in the expression of mAKAPβ between the controls and the cells treated with AngII at the designated concentration (all P>0.05). GAPDH was used as an equal loading control. The band value was quantified by densitometric analysis. Experiments were repeated at least 3 times. Data are expressed as the means ± SD in the corresponding bar graph and statistical significance was determined by the Student’s t-test. Ctrl, control; Phe, phenylephrine; ns, not significant. Columns, mean; error bars, ± SD.

