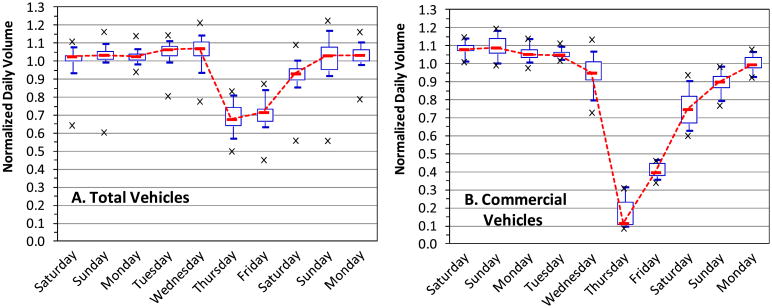
Fig. 3.
Daily normalized volume for Thanksgiving period for total vehicles at 14 sites (A. left panel) and for commercial vehicles at four sites (B. right panel). Plots shows 5th, 25th, 50th (red bar), 75th and 95th percentile values, and minimum and maximum observations as points. Dashed line shows trend of median over the 10-day period. Based on 51 to 54 site-years for each day for total vehicles and 12 to 14 site-years for commercial vehicles. (For interpretation of the references to color in this figure legend, the reader is referred to the web version of this article.)

