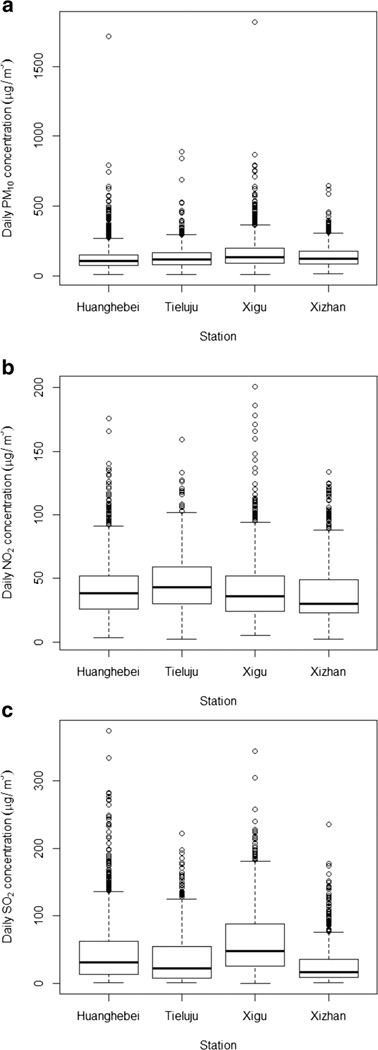
Fig. 3.
Pollutant levels over the study period, by station. a PM10; b NO2; c SO2. Note: The upper and lower horizontal lines of the box represent the 75th and 25th percentiles, respectively. The horizontal line within a box represents the median. The open circles (outliers) represent observations less than the 25th percentile—1.5 × interquartile range (IQR), or larger than the 75th percen-tile+1.5×IQR. The vertical line above each box represents the 75th percentile to the lowest observation that exceeds the 75th percentile, but is not an outlier. The vertical line below each box represents the 25th percentile to the highest observation that is lower than the 25th percentile, but is not an outlier

