Figure 1.
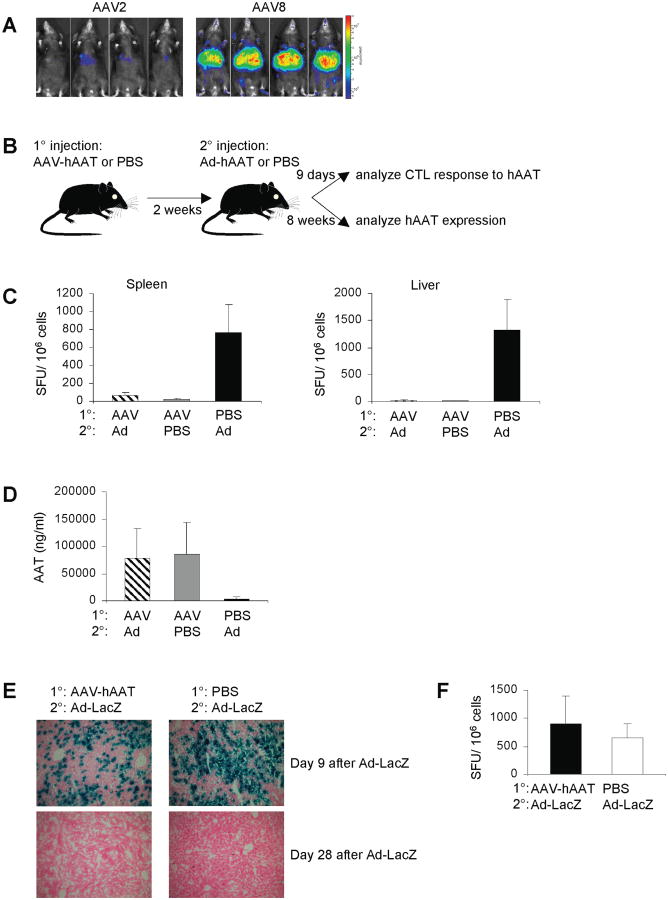
Establishment of a model of systemic antigen-specific T cell tolerance. (A) Mice were injected i.v. with 1010 VG of AAV2 or AAV8 expressing luciferase. At day 14 whole body bioluminescence was visualized. (B) Mice were injected i.v. with 1011 VG of AAV-hAAT, and then 2 weeks later challenged i.v. with 1010 particles of Ad-hAAT. Control mice were injected with PBS. (C) At 9 days after the Ad-hAAT injection, splenocytes or liver leukocytes were stimulated with the hAAT CD8 T cell epitope and subjected to the IFN-γ ELISPOT assay. Background spot-forming unit (SFU) values were subtracted prior to plotting. (D) At 8 weeks after the Ad-hAAT injection, hAAT plasma levels were measured using ELISA. (E) Mice were injected i.v. with 1011 VG of AAV-hAAT or PBS, and then 2 weeks later challenged i.v. with 1010 particles of Ad-LacZ. Livers were processed for LacZ expression 9 and 28 days later. (F) Mice were injected i.v. with 1011 VG of AAV-hAAT or PBS, and then 2 weeks later challenged i.v. with 1010 particles of Ad-LacZ. Nine days after the Ad-LacZ injection, splenocytes were stimulated with the LacZ CD8 T cell epitope and subjected to the IFN-γ ELISPOT assay. Background SFU values were subtracted prior to plotting. Data represent groups of three mice in three independent experiments that gave similar results.

