
Figure 1. Biphasic kill curve during the antibiotic treatment.
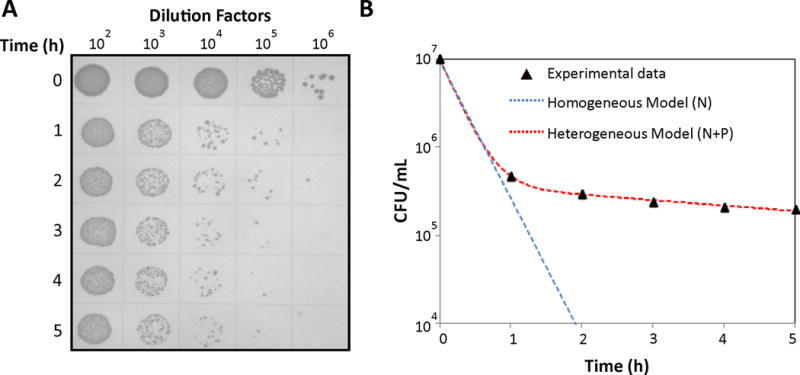
A. Overnight culture of E. coli MG1655 was diluted (100-fold) in fresh 50 mL LB and cultured for 2 h at 37 °C and 250 rpm to reach an exponential growth phase. Then, the culture was treated with OFL for 5 h. Culture samples were collected every hour during the course of antibiotic treatment, washed, serially-diluted, and plated on LB agar. After incubating the agar plate at 37°C for 16 h, CFUs were counted by taking the dilution factors into consideration. B. Biphasic kill curve was obtained when CFUs/mL were plotted on a logarithmic scale as a function of treatment time. If the culture were comprised of a single homogeneous population , a single killing rate would be observed (blue line). The biphasic nature of the kill curve demonstrates that the population was heterogeneous with at least two culturable cell-types (red line). N and P represent the abundance of normal cells and persisters, whereas kn and kp represent the net killing rates of normal and persister cells per unit time in the presence of antibiotics.