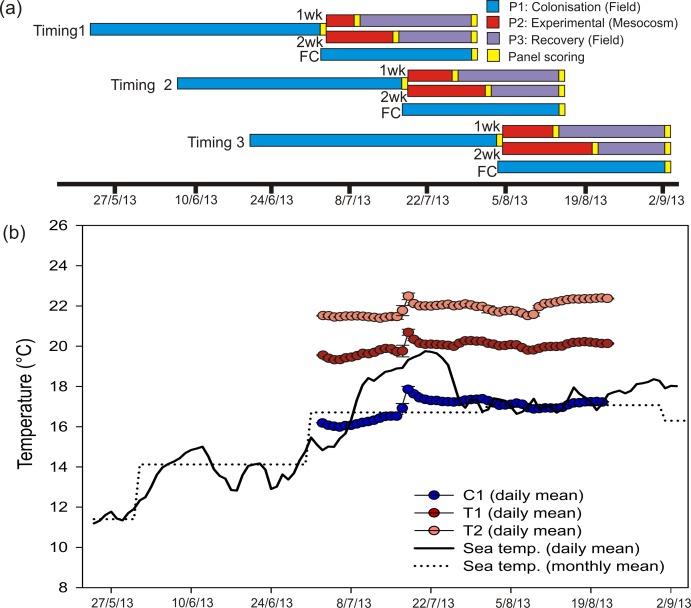
Figure 1. Heat wave simulations and experimental design.
Experimental design and temperature treatments. (A) Coloured bars show timings and durations of experimental phases within each HW Timing. For each Timing, a set of Field Controls (FC) remained in situ. (B) Time series indicating sea temperature at the study site (daily means are based on 72 records per day, taken every 20 min; monthly mean generated from daily temperatures recorded over 3 preceding years), as well as mean daily temperatures (n = 5 mesocosm tanks ± SD) for each HW Magnitude treatment during the experimental period.

