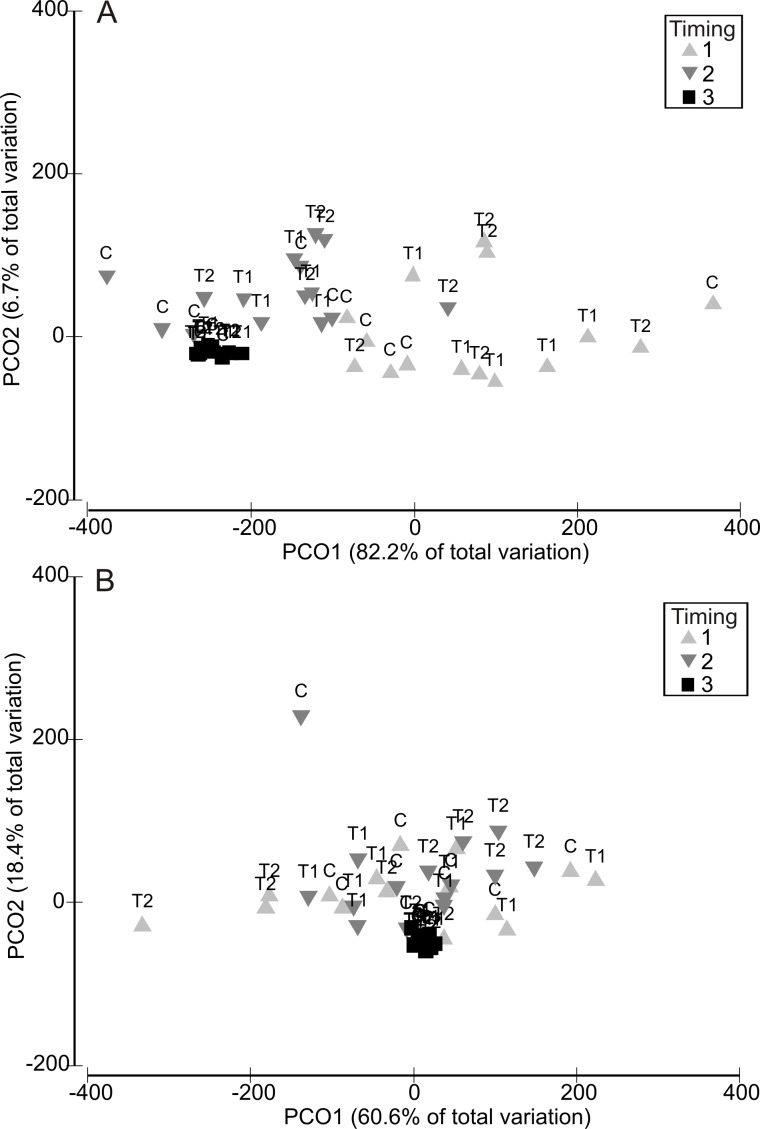
Figure 4. Relative changes in assemblage structure following the recovery period (Phase 3).
Principal Coordinates Analysis (PCO) plots indicating relative changes in multivariate assemblage structure between the colonisation phase (Phase 1) and the recovery phase (Phase 3) for the 1 week (A) and 2 week (B) HW exposures. Multivariate partitioning is based on Euclidian distances between untransformed differences in abundance between Phase 1 and Phase 3. Centroid symbols indicate the HW Magnitude treatment for each panel (C = Controls at ambient temperature, T1 = +3 °C, T2 = +5 °C) and labels indicate the different HW Timings (i.e., experimental runs).

