
Figure 5. Regulation of cellular protrusion orientation and migratory patterns by zyxin and binding partners.
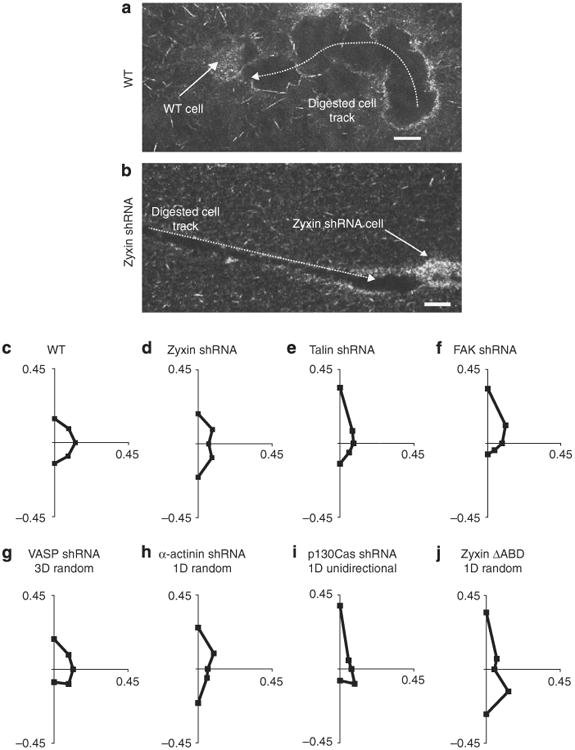
(a,b) Confocal reflection micrographs of typical tracks generated by an individual WT cell (a) and a zyxin-depleted cell (b) fully embedded inside a collagen I matrix. Scale bars represent 20μm. (c-j) Angular distributions of pseudopodial protrusions displayed by WT cells (c), zyxin-depleted cells (d), talin-depleted cells (e), FAK-depleted cells (f), VASP-depleted cells (g), α-actinin-depleted cells (h), p130Cas-depleted cells (i) and zyxin ΔABD cells (j) along the periphery of cells fully embedded inside a 3D matrix for a 12-h observation time. For each case, the direction of the first recorded protrusion is arbitrarily taken as pointing north, corresponding to the positive y axis of the graphs. Axes labels represent the fraction of the total number of protrusions, measured across multiple cells, which occurred in each radial direction about the centroid of the cells during the 12-h observation. Graphs of protrusion orientation summarize results within the specified mode of motility sub-population for a minimum of 100 protrusions and 8 cells over 12 h. Supplementary Figure S3 explains the methodology used to determine the orientation of protrusions in further detail.