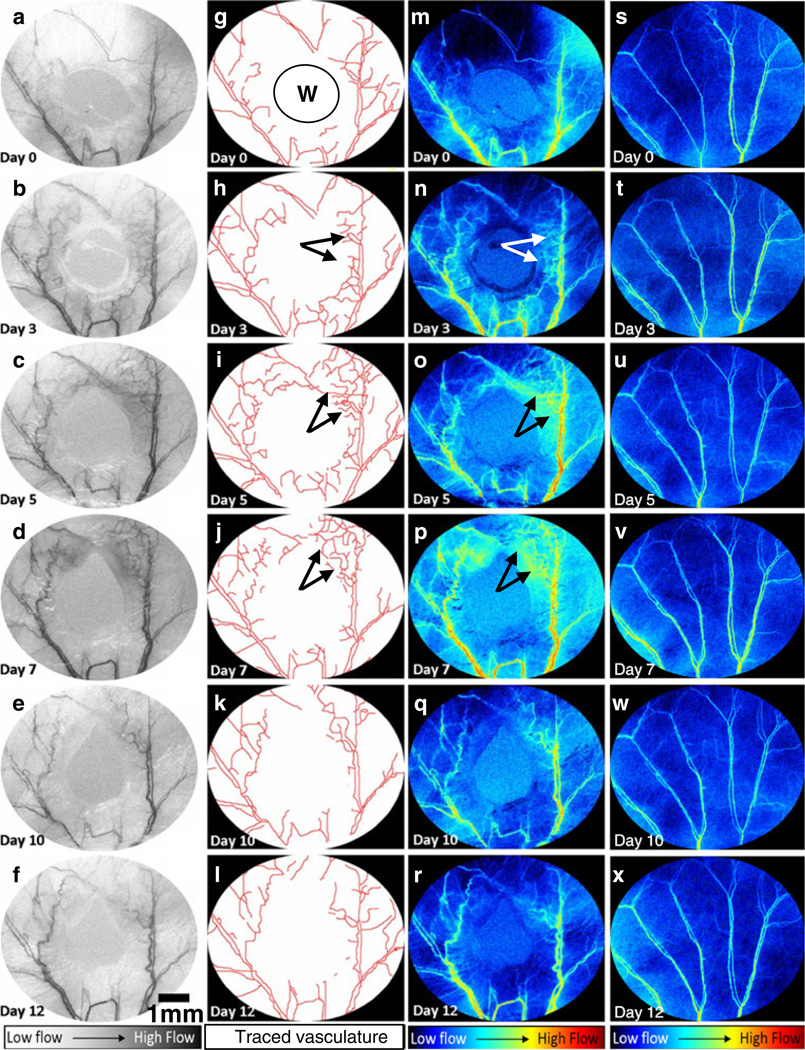
Fig. 2.
In vivo angiogenic response during wound healing using LSCI in a mouse ear model: The first column (a–f) shows representative sequential LSCI images acquired on days 0, 3, 5, 7, 10 and 12 after wound creation (indicated by W). The outlines of these vessels were manually segmented as shown in the second column (g–l). The third column (m–r) shows the changes in blood flow (1/τc values) that occur during the wound healing period. For comparison, the fourth column (s–x) shows changes in blood flow (1/τc values) over the same period in a control mouse ear. These color mapped images were obtained using the procedure described in Fig. 1c. Regions indicated by arrows exhibited an increase in neovascularization and average flow until day 7, which then subsided as healing completed

