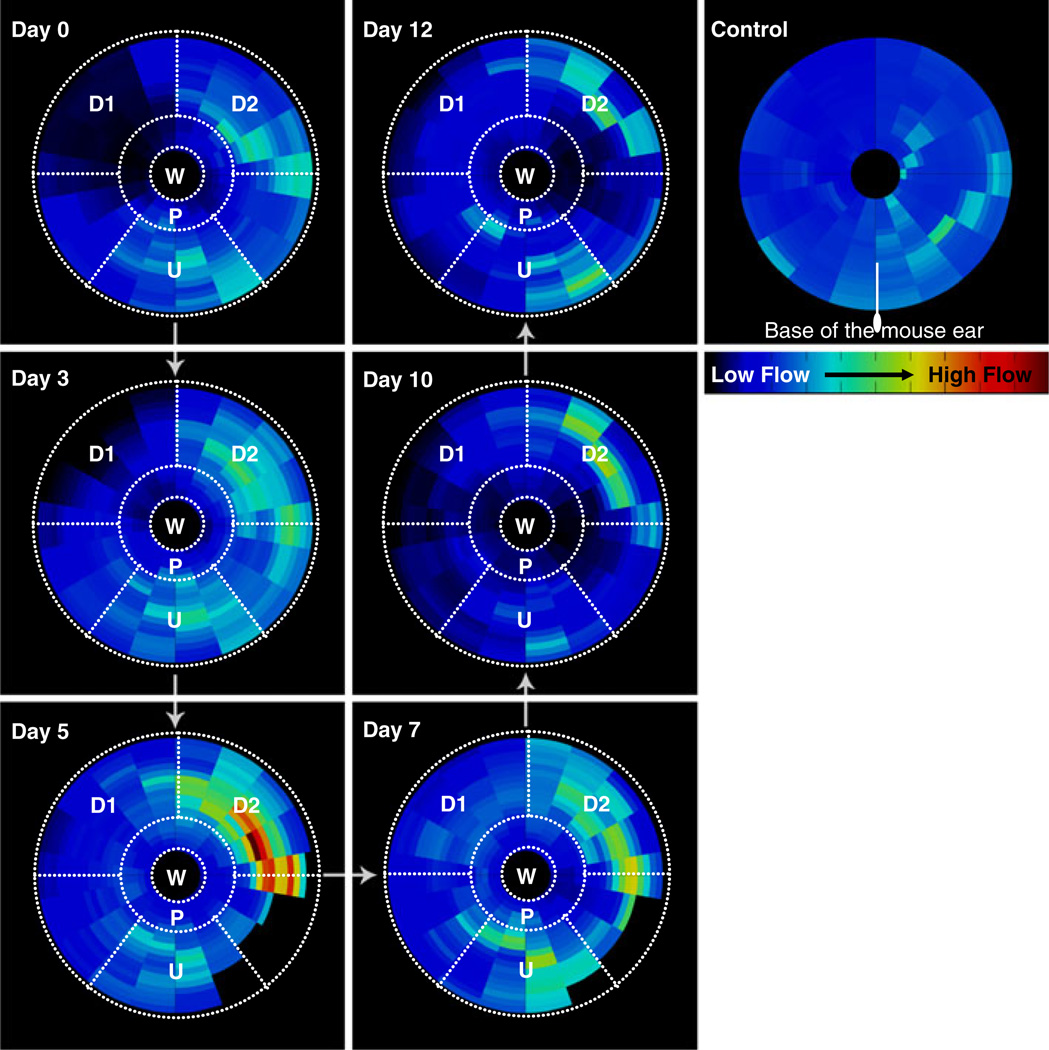
Fig. 4.
Spatiotemporal analysis of in vivo blood flow changes in the wound periphery: This circular plot illustrates the mean blood flow (computed from all mice in the cohort) in the wound periphery as a function of its orientation with respect to the wound and the base of the ear. The wound is represented on all plots as a circle of fixed diameter and each concentric region around it represents a 50 µm wide region. The radial distance on each plot is the shortest distance of that region from the wound outline, and is analyzed in increments of 50 µm. Similarly, the angle (0° < θ < 360°) on the plots is the angle that a line joining the region with the wound center subtends with the line joining the base of the ear with wound center in the counter clockwise direction. Salient observations were made in each of the following ROIs—W: wound, P: proximal region, U: upstream region, D1: downstream region 1, D2: downstream region 2

