Figure 4.
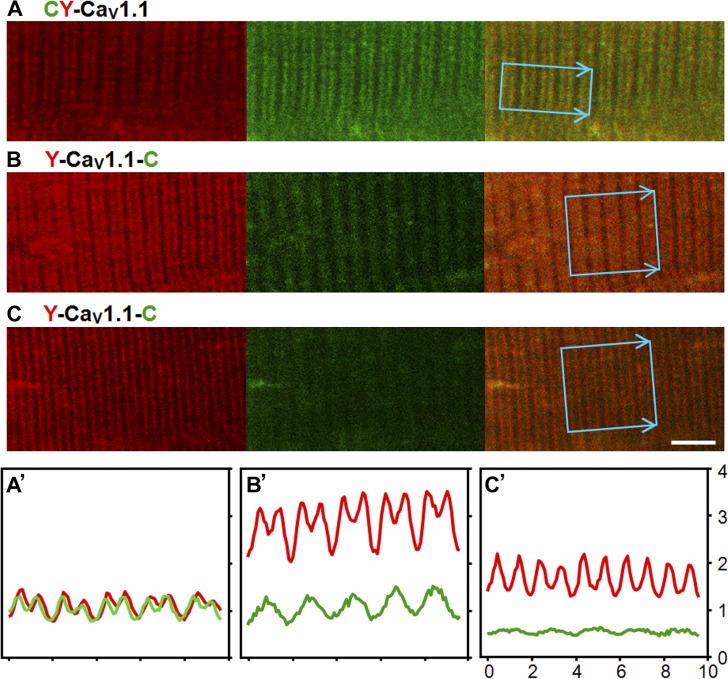
Confocal fluorescence images representative of the patterns observed for CFP-YFP-CaV1.1 (A) or YFP-CaV1.1-CFP (B and C) obtained 2 wk after transfection of adult mouse FDB muscle; the yellow and cyan fluorescence are illustrated in red and green, respectively. The images were obtained with identical photomultiplier settings on an LSM710 confocal microscope; the corresponding average intensity profiles, within the indicated regions of interest, are illustrated in A′, B′, and C′, with the horizontal and vertical axes corresponding to micrometer and average pixel intensity (×10−3), respectively. The intensities in B′ and C′ were scaled according to the ratio of laser intensity (for B or C) to corresponding laser intensity (for A). Thus, the intensity profiles indicate that, compared with the cell illustrated in A and A′, the expression of CaV1.1 was about threefold higher in B and B′ and ∼1.5-fold higher in C and C′. Calibration bar, 5 µm for all panels.

