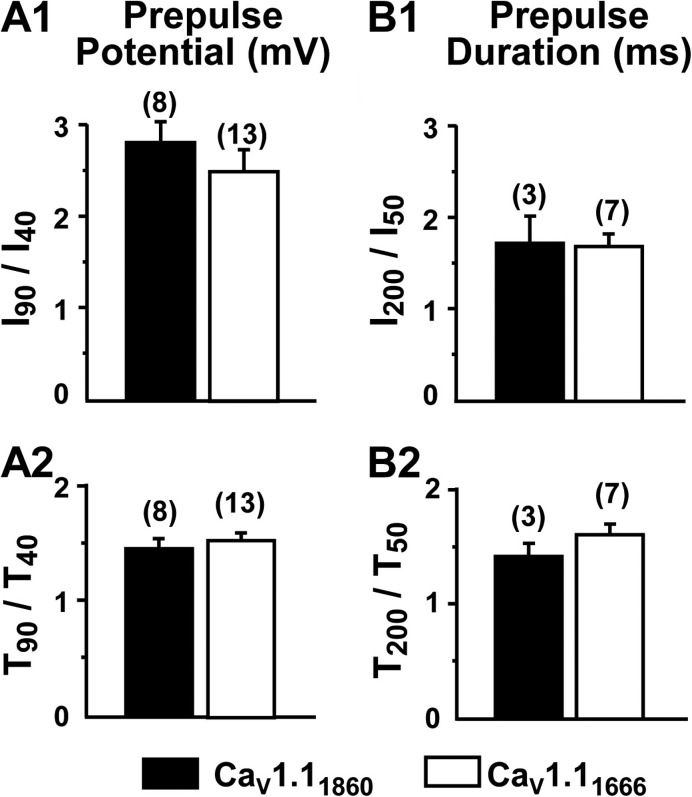
Figure 7.
Potentiation is quantitatively similar for CaV1.11860 and CaV1.11666. Both the amplitude (I) and half-decay time (T) were measured for tail currents upon repolarization after either 200-ms prepulses to 40 or 90 mV (A1 and A2), or after 90-mV prepulses of 50- or 200-ms duration (B1 and B2). The number of cells examined is indicated in parentheses. There were no statistically significant differences between CaV1.11860 and CaV1.11666 based on a rank-sum test (I90/I40, P = 0.205; I200/I50, P = 1.0) or t test (T90/T40, P = 0.486; T200/T50, P = 0.289). Tail current repolarization potential was −20 mV for CaV1.11860 and ranged from −20 to −40 mV for CaV1.11666 (see Materials and methods).

