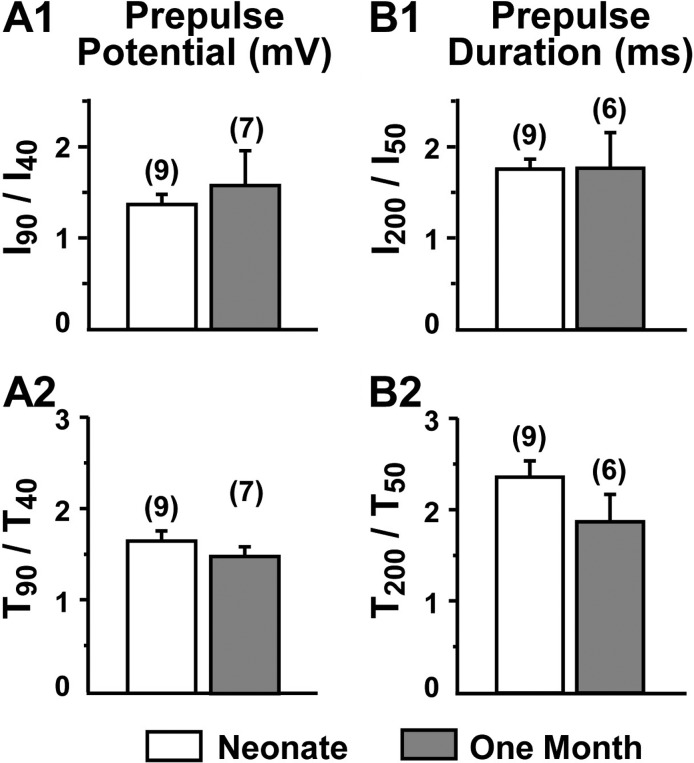
Figure 8.
Potentiation is quantitatively similar for native CaV1.1 in muscle fibers of neonatal (day 0 and day 1) mice and 1-mo-old mice. Potentiation was quantified as illustrated in Figs. 6 and 7 for tail currents produced by repolarization to −30 mV (number of cells in parentheses). t test comparisons of potentiation in dissociated FDB muscle fibers from neonatal and 1-mo-old mice yielded P = 0.23 for I90/I40 (A1), P = 0.39 for T90/T40 (A2), P = 0.90 for I200/I50 (B1), and P = 0.19 for T200/T50 (B2).

