Figure 3.
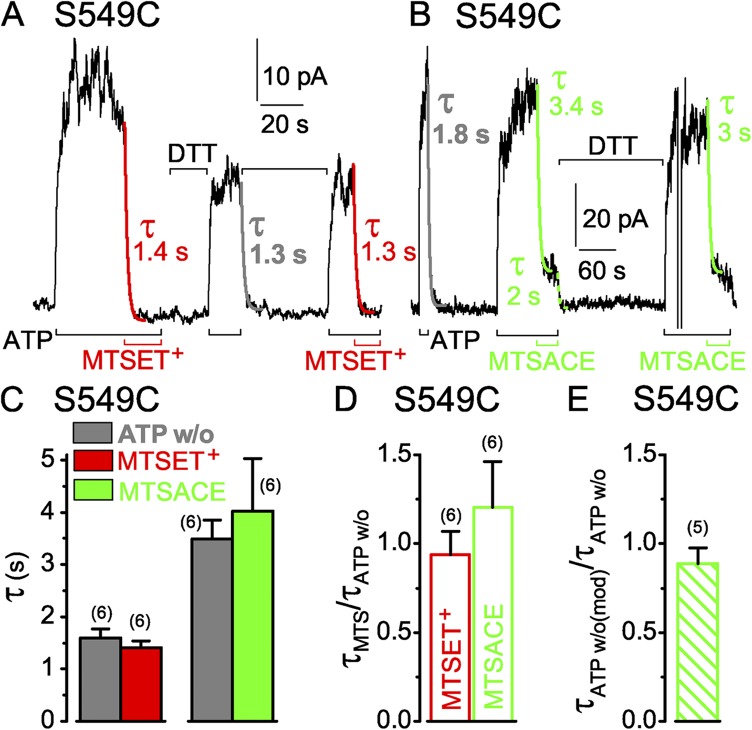
Similarly rapid decay of current in S549C CFTR channels (containing a single target Cys in the active catalytic site) upon ATP washout (w/o) or modification by MTS reagents. (A and B) S549C CFTR channels were activated by 3 mM ATP (black bars below records) and modified by 50 µM MTSET+ (A; red bars below record) or 5 and 50 µM MTSACE (B; green bars below record), and modification was reversed by DTT (A, 10 mM; B, 20 mM; black bars above record). Colored lines show single-exponential fits to current decay time courses on modification (τMTS) by MTSET+ (red) or by MTSACE (green), or on ATP removal (gray, τATPw/o) before modification, or on ATP removal after MTSACE modification (dotted green, τATPw/o(mod)); colored numbers give fit time constants; the time constants of Ca2+-dependent Cl− current decays in these patches were 0.3 s (A) and 0.2 s (B). (C) Average τATPw/o with corresponding average τMTS from the same patches (left: gray bar, w/o, 1.6 ± 0.2 s; red bar, ≥50 µM MTSET+, 1.4 ± 0.1 s; n = 6 measurements in five patches; right: gray bar, w/o, 3.5 ± 0.4 s; green bar, ≥50 µM MTSACE, 4.0 ± 1 s; n = 6 measurements in four patches); slower washout and modification time courses in the MTSACE experiments likely reflected slower superfusion influenced by patch geometry, but comparisons were always made within the same patch. (D) Averages of individual ratios of washout and modification time constants determined for each pair of measurements (from experiments of C; red open bar, τMTSET/τATPw/o, 0.9 ± 0.1; green open bar, τMTSACE/τATPw/o, 1.2 ± 0.3). (E) Average of washout time constant ratios, before and after MTSACE modification (green hatched bar, τATPw/o(mod)/τATPw/o, 0.9 ± 0.1; n = 5); absolute current amplitude of MTSACE-modified channels was 7–22 pA. Error bars represent mean ± SEM.

