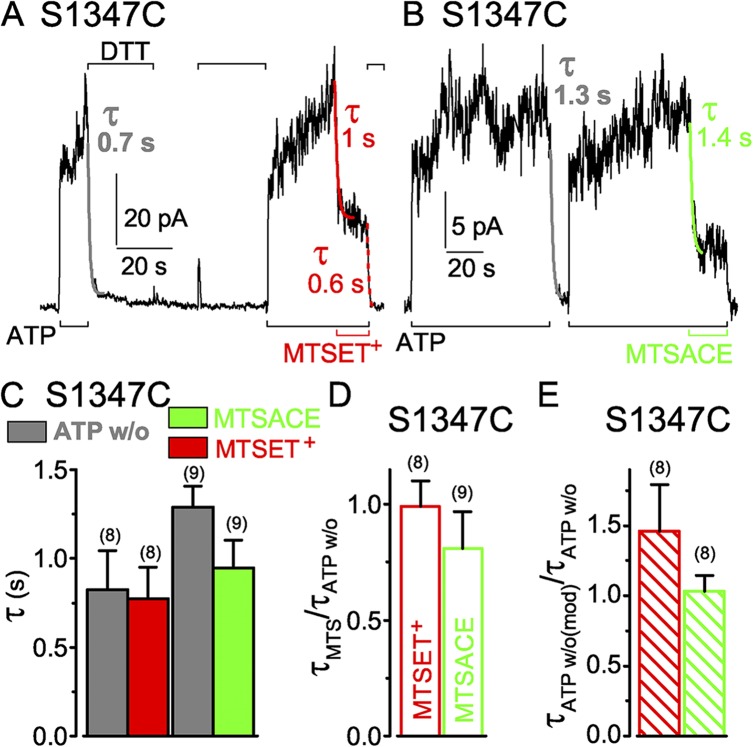
Figure 5.
Similarly rapid decay of current in S1347C CFTR channels (containing a single target Cys in the dead composite site) upon ATP washout (w/o) or modification by MTS reagents. (A and B) S1347C CFTR channels were activated by 3 mM ATP (black bars below records) and modified by 1 mM MTSET+ or MTSACE (A and B, red and green bars below records, respectively). Colored lines show single-exponential fits to current decay time courses on modification (τMTS) by MTSET+ (red) or by MTSACE (green), or on ATP removal (gray, τATPw/o) before modification, or on ATP removal after MTSET+ modification (dotted red, τATPw/o(mod)); colored numbers give time constants; the time constants of Ca2+-dependent Cl− current decays in these patches were 0.1 s (A) and 0.3 s (B). (C) Average τATPw/o (gray bars) with corresponding average τMTS from the same patches (left: gray bar, w/o, 0.8 ± 0.2 s; red bar, ≥50 µM MTSET+, 0.8 ± 0.2 s; n = 8 measurements in six patches; right: gray bar, w/o, 1.3 ± 0.1 s; green bar, ≥50 µM MTSACE, 0.9 ± 0.2 s; n = 9 measurements in seven patches). (D) Averages of individual ratios of washout and modification time constants determined for each pair of measurements (from experiments of C; red open bar, τMTSET/τATPw/o, 1.0 ± 0.1; green open bar, τMTSACE/τATPw/o, 0.8 ± 0.2). (E) Ratio of washout time constants before and after MTSET+ and MTSACE modification (τATPw/o(mod)/τATPw/o: red hatched bar, MTSET+, 1.5 ± 0.3, n = 8 measurements in six patches; green hatched bar, MTSACE, 1.0 ± 0.1; n = 8 measurements in seven patches); absolute current amplitudes were 5–64 pA for MTSET+-modified channels and 6–80 pA for MTSACE-modified channels. Error bars represent mean ± SEM.

