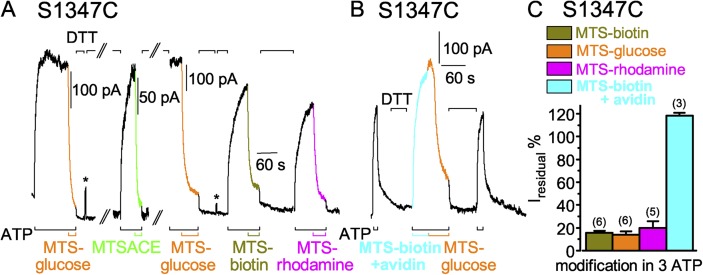
Figure 9.
Larger MTS reagents relatively rapidly modify S1347C CFTR channels in the presence of ATP. (A and B) S1347C channels were activated by 3 mM ATP (black bars below records) and modified by 50 µM MTS-glucose (A and B; orange traces and bars), 50 µM MTSACE (A; green trace and bar), 50 µM MTS-biotin (A; dark yellow trace and bar), or 50 µM MTS-rhodamine (A; magenta trace and bar), but not by the MTS-biotin–avidin complex (B; 50 µM biotin plus 60 µM avidin, cyan trace and bar). Each modification was reversed by 20 mM DTT (A and B; black bars above record). Asterisks above the record in A mark brief activations of Ca2+-dependent Cl− currents to monitor speed of solution exchange (here, 0.3 s and 0.2 s); the gaps in A omit 30 and 450 s, and during the second gap the channels were rephosphorylated with PKA catalytic subunit. (C) Amplitude of residual ATP-activated current (Iresidual %), as a fraction of ATP-dependent current before MTS treatment, for S1347C channels modified, while opening and closing (in 3 mM ATP), by MTS-biotin (dark yellow bar, 16 ± 2%, n = 6 measurements in six patches), by MTS-glucose (orange bar, 14 ± 3%, n = 6 measurements in three patches), by MTS-rhodamine (magenta bar, 18 ± 6%, n = 6 measurements in five patches), and MTS-biotin–avidin complex (cyan bar, 119 ± 2%, n = 3 measurements in two patches). Error bars represent mean ± SEM.

