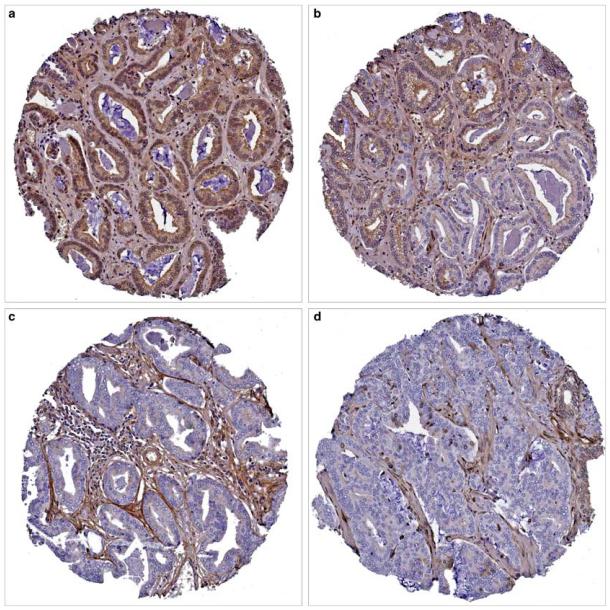
Figure 1.
Patterns of PTEN (phosphatase and tensin homolog on chromosome 10) expression in prostate carcinoma. (a) Diffuse cytoplasmic PTEN expression. (b) Reduced PTEN expression, more obvious in the glands at the lower right. (c, d) Markedly decreased to negative PTEN expression in all glands. Note the PTEN positivity in the stromal cells. Tissue microarray spots at (b–d) were classified as ‘markedly decreased PTEN expression’.

