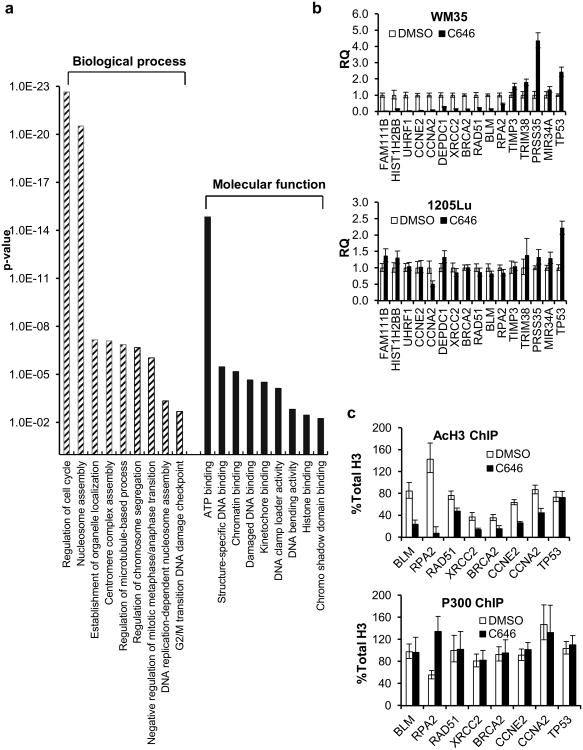
Figure 2.
Gene expression profiling of WM35 cells after p300 HAT inhibition. (a) GO analysis of genes that were repressed by ≥2-fold after 24 h of treatment with 20 μM C646. The p-values represent the significance of the gene clustering. (b) qPCR validation of selected gene targets in WM35 and 1205Lu cells. The data were normalized to the DMSO control with GAPDH as the endogenous gene control. N≥3. (c) ChIP-qPCR analysis of acetylated H3 and p300 enrichment near the transcription start sites of selected genes. The data were normalized to total H3 ChIP; a GAPDH promoter sequence served as the endogenous control. N≥3.

