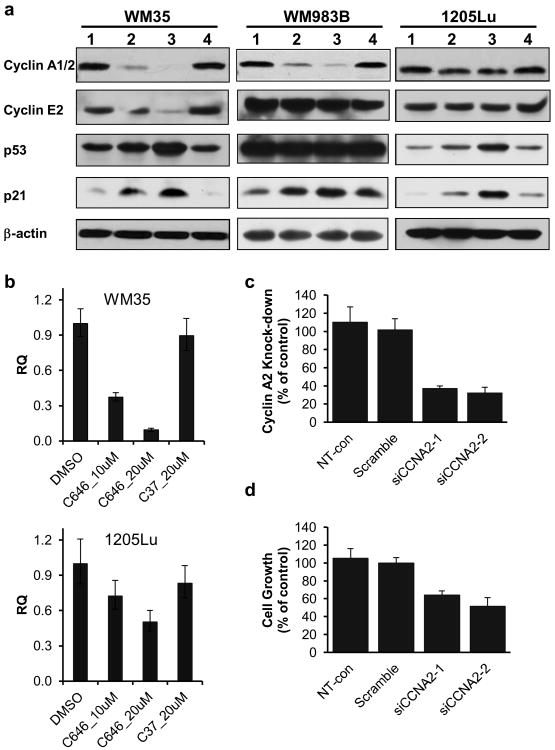
Figure 3.
Expression of selected growth regulatory genes in C646 sensitive and insensitive cell lines. (a) Western blot analyses on WM35, 1205Lu and WM983B cells. Lanes 1-4 represent 24 h of treatment with 0.2% DMSO, 10 μM C646, 20 μM C646 and 20 μM C37, respectively. (b) qPCR analysis of CCNA2 transcripts in WM35 and 1205Lu cells after 24 h treatment. N≥3. Please note that the Western blot antibody detects both CCNA1 and CCNA2, while the qPCR only detects CCNA2. (c) Relative expression of CCNA2 after siRNA transfection, as determined by qRT-PCR. (d) Relative cell proliferation measured by the MTT assay 96 h after plating the siRNA-transfected cells.

