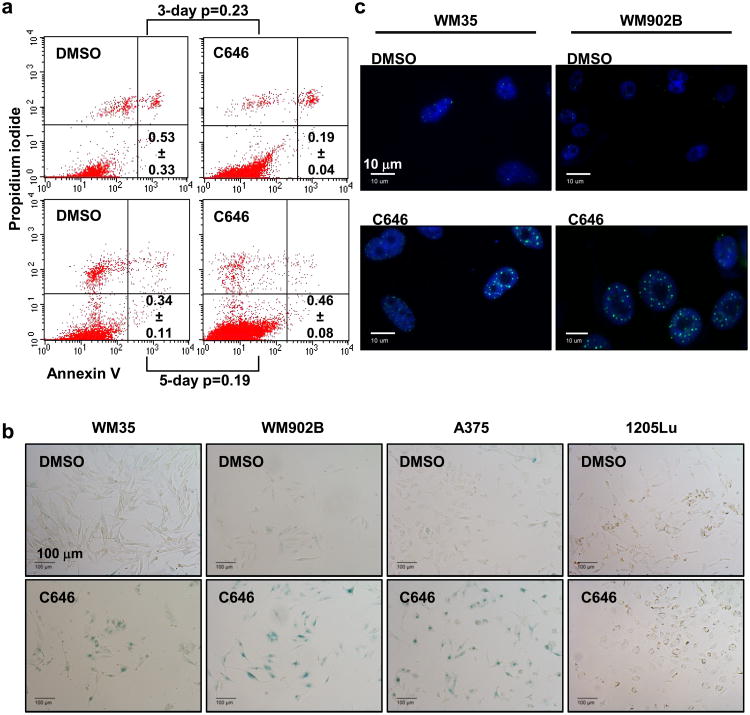
Figure 4.
Analyses of WM35 cell phenotype after extended p300 inhibition. (a) FACS analysis of apoptotic cells after 3 and 5 d of treatment with C646 (20 μM) or DMSO. The population in the lower right quadrant contains early apoptotic cells. The numbers represent the average %apoptotic cells from 3 independent experiments ± SD. P-values were derived from Student's t-test. (b) Representative images of SA-β-gal staining in WM35, WM902B, A375 and 1205Lu cells treated for 4 d. Strong perinuclear staining is considered SA-β-gal positive. Scale bars: 100 μm. (c) PML immunofluorescence staining for senescence detection of WM35 and WM902B cells. C646 treatment induced larger and flattened nucleoli as well as more SAHF formations compared to the DMSO treatment. Of note, DMSO-treated cells also showed basal levels of SAHF formation. Scale bars: 10 μm.

