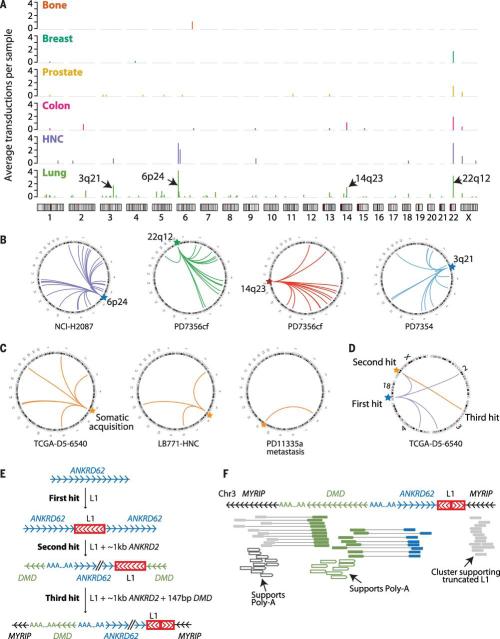
Fig. 3. Somatic 3′ transductions originate from a limited repertoire of L1 source elements.
(A) Rate of source element activity within and among tumor types. The y axis denotes the average number of transductions involving the given element per sample for that tumor type. (B) Individual source elements show dramatic transduction activity in some lung cancer genomes. (C) Transductions arising from somatically acquired L1 copies in a colon cancer (TCGA-D5-6540), a head and neck cancer (LB771-HNC), and a prostate cancer (PD11335a). (D) Three-hit somatic retrotransposition example. A full-length L1 element acquired somatically (first hit) generated four somatic transductions, one of which (second hit) induces further mobilization, leading to a third hit. (E) Structural configuration of the breakpoints originated in the three-hit retrotransposition example. An intact L1 is somatically retrotransposed into ANKRD62, causing further transduction of 1114 bp of ANKRD62 into DMD. A subsequent transduction picks up some of DMD together with ANKRD62 and inserts both into MYRIP on chromosome 3 (third hit). (F) Read clusters supporting breakpoints shown in (E). Paired reads are shown as boxes connected with lines, colored by the genomic region they map to.

