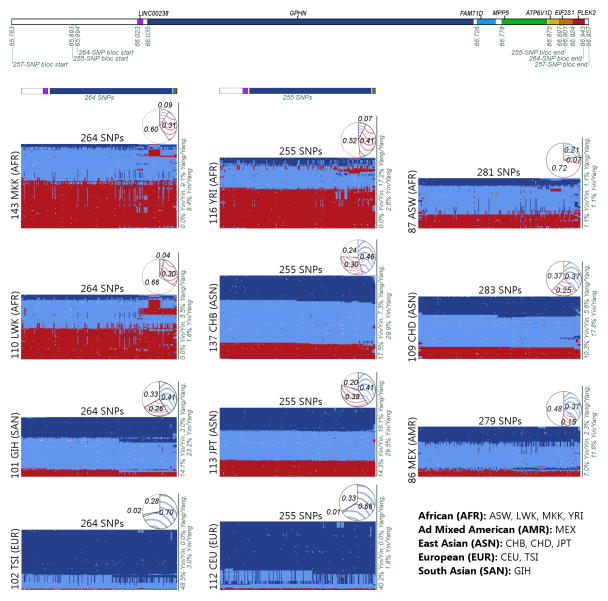
Figure 1. Yin-yang haplotypes.
(Best viewed in color, high-resolution image available online as Supplementary Fig. 3.) Upper panel: Yin-yang region with color-coded genes and positions in kb. Lower panel: Genotypes for the yin-yang haplotypes. The first column of matrices represents the ‘yin’ bloc identified in the analysis of the GIH, LWK, MKK, and TSI populations. The middle column represents the ‘yin’ bloc from the CEU, CHB, JPT, and YRI analysis. The last column represents the available yin-yang SNPs for each of the three additional HapMap populations: ASW, CHD, and MEX. For each matrix, each column represents a SNP and each row represents an individual (rows are rearranged to place similar individuals near each other). Color-coded bars at top of the first two columns indicate SNP positions by matching the gene color from the top panel. Dark blue indicates homozygote for SNP allele in the bloc, red for homozygote for alternate allele, light blue for heterozygote, and white for missing data. A solid dark blue horizontal line represents an individual that possesses two yin haplotypes and a solid red line represents a yang homozygote. Percentages of individuals that are homozygotes or heterozygotes for the yin and yang haplotypes are shown on the right side of each matrix. Yin (blue) and yang (red) haplotype frequencies are shown in pie chart above each matrix, with white indicating the percentage of haplotypes that are not 100% yin nor 100% yang.

