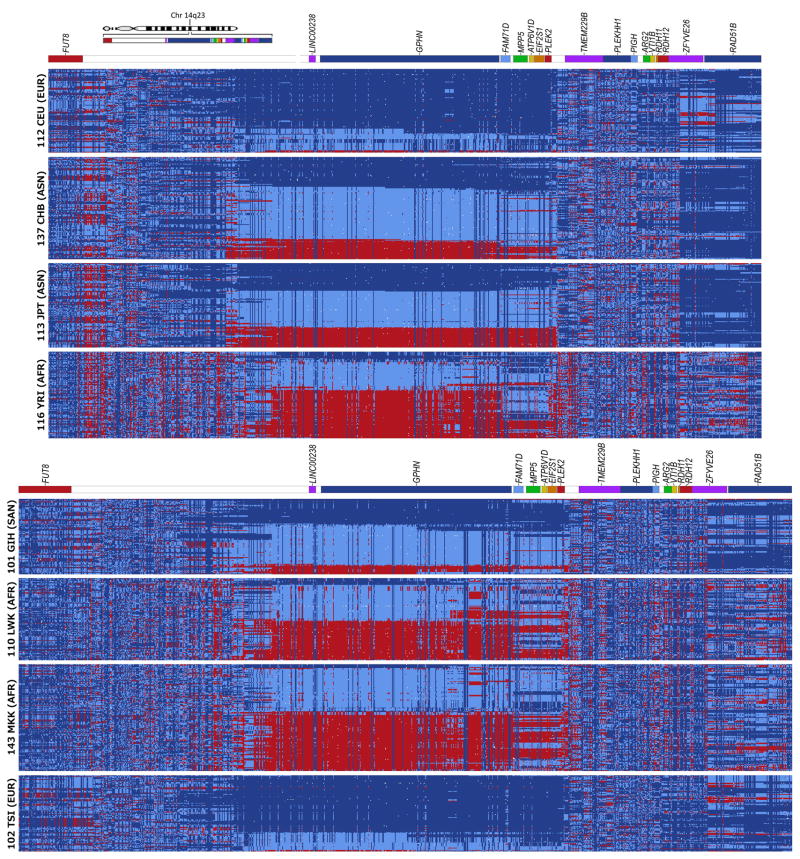
Figure 3. All SNPs within and surrounding yin-yang region.
The available HapMap SNPs within the yin-yang region (355 for the first four populations and 436 for the second four populations) are shown, along with 300 SNPs upstream and 300 downstream. (Best viewed in color; see Fig. 1 caption for details.) Homozygotes in the minor allele for the CEU or TSI populations are colored red, heterozygotes are light blue, homozygotes in the alternate allele are dark blue, and missing data are white. SNPs with low minor allele frequencies (MAF) appear as vertical columns that are predominantly either dark blue or red. Color bars above each group indicate the distributions of the SNPs across genomic regions. High resolution images are available online as Supplementary Figs. 4 – 11.

