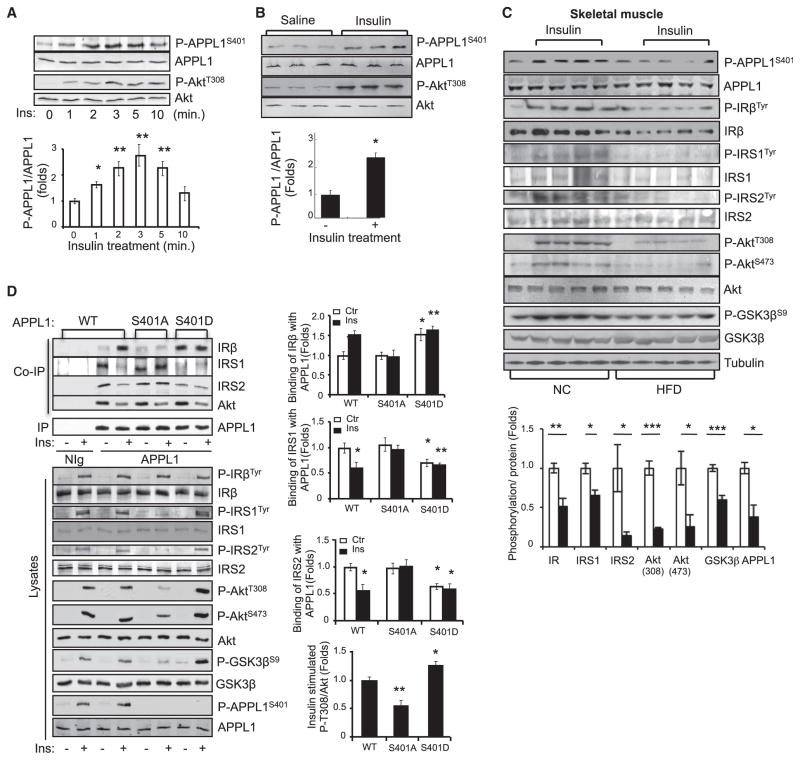
Figure 6. Ser401 Phosphorylation Is Essential for the Promoting Effect of APPL1 on Insulin Signaling.
(A) C2C12 myotubes were serum starved and treated with insulin (10 nM) for the indicated times. Phosphorylation of APPL1 and Akt were detected by western blot analysis with the specific antibodies indicated.
(B) C57BL/6 mice were fasted and injected with saline or insulin (0.5 U/kg of body weight, 3 min). The phosphorylation of APPL1 and Akt and their protein expression in muscle tissues were detected by western blot analysis. n = 9 per group.
(C) Normal chow (NC) and high-fat diet (HFD)-fed male C57BL/6 mice were fasted overnight and treated with or without insulin (0.5 U/kg of body weight, 3 min). The phosphorylation of APPL1 and APPL1 protein in muscle tissues was detected by western blot analysis. Phosphorylation of IRβ, IRS1, and IRS2 was detected after immunoprecipitation with indicated antibodies, respectively. Bar graphs represent the ratios of insulin-stimulated phosphorylation over their total protein levels. n = 4 per group.
(D) APPL1-suppressed C2C12 myoblasts were transfected with myc-tagged and RNAi-resistant wild-type (WT), S401A, or S401D mutants of APPL1. The cells were serum starved and treated with or without 100 nM insulin (3 min). WT and mutants of APPL1 were immunoprecipitated with an anti-myc antibody. Bar graphs represent the binding of IRβ, IRS1, or IRS2 to APPL1 protein. Data are mean ± SEM from three independent experiments.
All results are presented as mean ± SEM. p values were calculated using the Student’s t test (*p < 0.05, **p < 0.01, ***p < 0.001). See also Figure S4.

