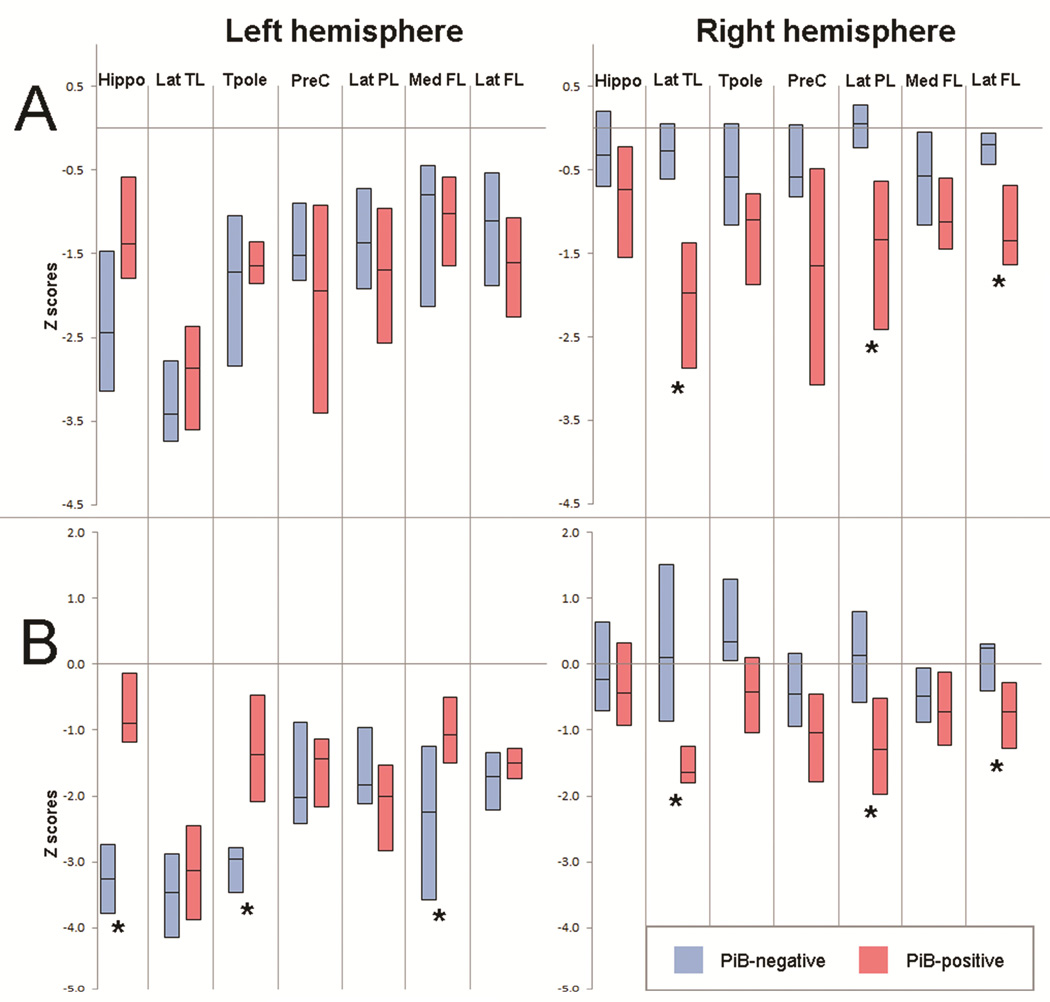
Figure 2. Box-plots of regional MRI grey matter volumes (A) and FDG-PET uptake ratios (B) expressed as Z scores.
Hippo=hippocampus; Inf TL=inferior temporal lobe; Mid TL=middle temporal lobe; Sup TL=superior temporal lobe; Tpole=temporal pole; PreC=precuneus; Inf PL=inferior parietal lobe; Sup PL=superior parietal lobe; Med FL=medial frontal lobe; Lat FL=lateral frontal lobe; OL=occipital lobe. * Significant difference between PiB-negative and PiB-positive groups

