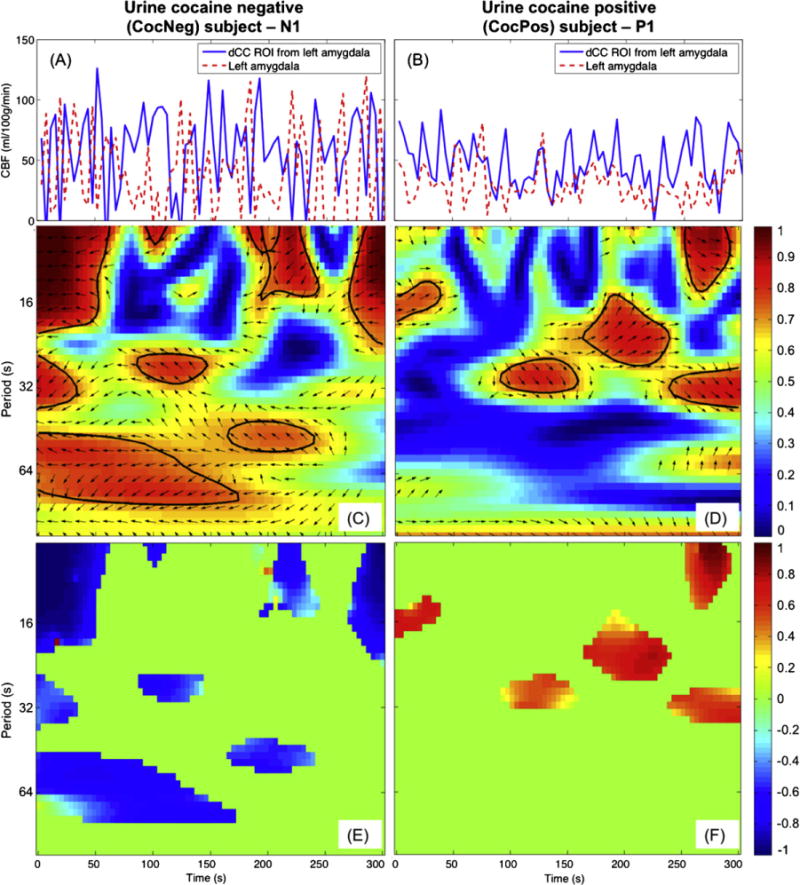
Fig. 1.

CocNeg subject (left column) showed consistent antiphase between the left amygdala and dCC rCBF signals but antiphase was not evident in the CocPos subject (right column). rCBF time signals series (A and B), WTC maps with phasor arrow overlaid (C and D) and characteristic coherence K maps (Eand F) of the left amygdala and dCC ROI.
