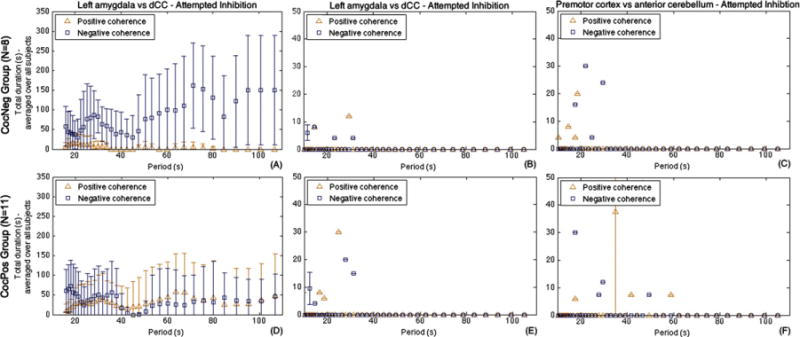
Fig. 3.

The CocNeg group (top row) had longer duration of negative coherence (blue squares) between left amygdala and corresponding dCC ROI as compared to the CocPos group (A and D). This relationship was absent during the resting state (B and E). Additionally, the relationship was absent when examining two non a priori regions, left premotor cortex and anterior cerebellum, during attempted inhibition (C and F). Each longitudinal point (triangle/square) represents the mean total duration of the corresponding characteristic coherence K across the subjects in the 2 groups, and error bar represents standard error. Please refer to supplementary materials Fig. S4 (see footnote1) for right amygdala vs. its corresponding dCC.
