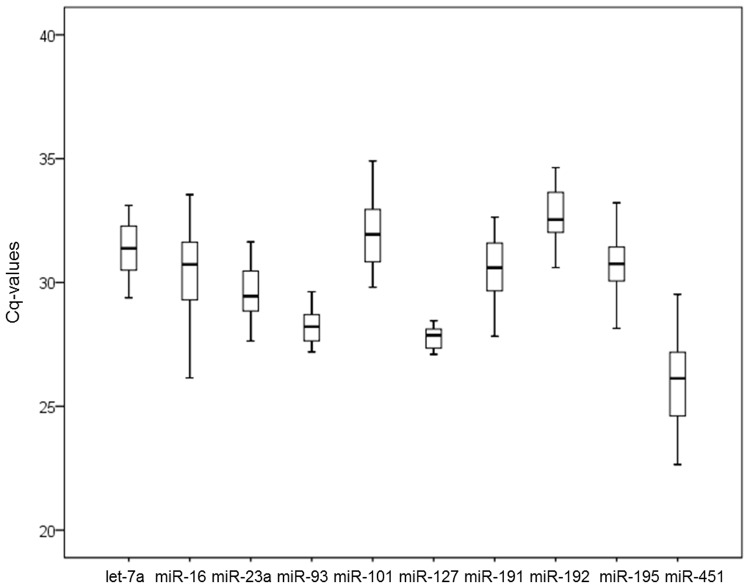
Fig 1. Expression levels of candidate reference miRNAs in bovine serum.
The expression levels of ten candidate miRNAs were validated in bovine serum. Box plots of raw Cq values were produced. Boxes represent the lower and upper quartiles with median (n = 34). Values are given as real-time PCR cycle threshold numbers. Box and whisker plot displaying the range of Cq values for each putative reference miRNA. The median is marked by the middle line in the box. The boxes represent the 25th and 75th percentiles, and ranges are represented by the whiskers.

