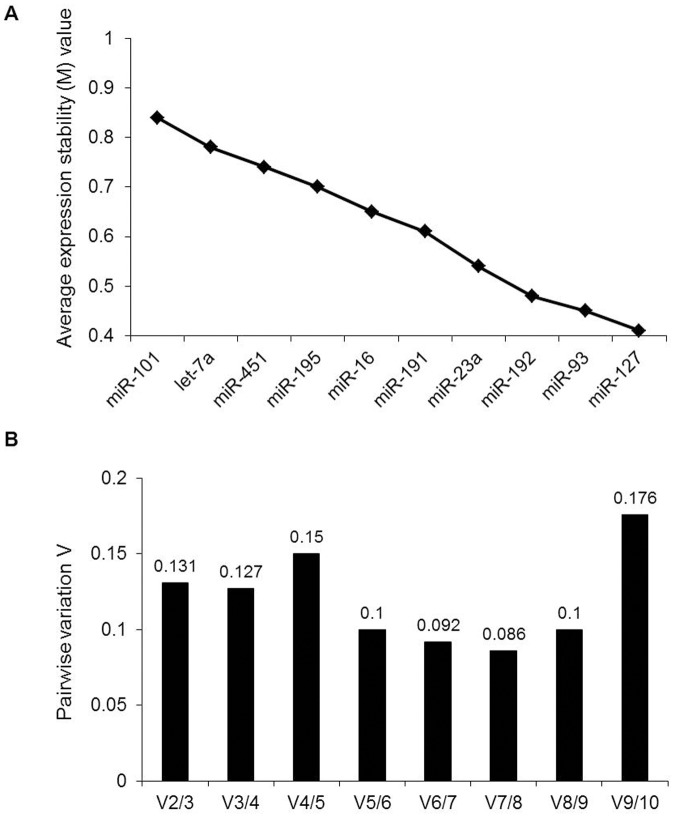
Fig 2. geNorm analysis of qRT-PCR of candidate reference genes.
(A) Ranking of candidate reference genes according to average expression stability (M value). The x-axis from left to right indicates the ranking of the genes according to their expression stability. (B) Determination of the optimal number of reference genes for normalization. The software calculates the normalization factor from at least two genes; the variable V defines the pairwise variation between two sequential normalization factors.

