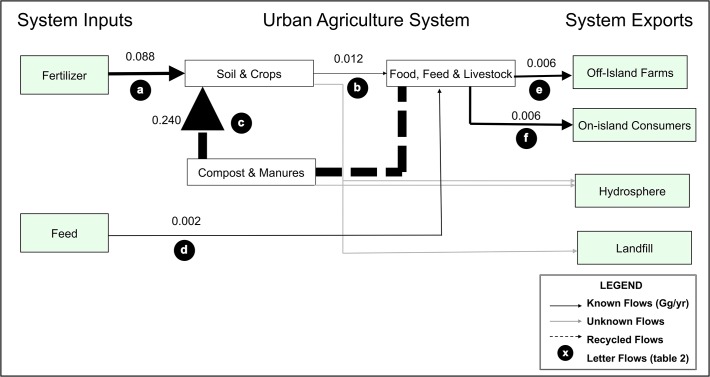
Fig 3. Phosphorus flows in the urban agriculture (UA) system on the island of Montreal in gigagrams of P yr-1 where the size of arrows represents the magnitude of flows.
Recycled flows are represented by dashed arrows, and unknown flows (i.e., runoff and erosion to the waterways, and amount of organic material from UA sent to landfill) are represented by grey arrows. Green boxes represent inputs and exports to and from the UA system. Letters in black circles represent the flow identification letters, which are associated with a description of the flow and calculation methods in Table 2.

