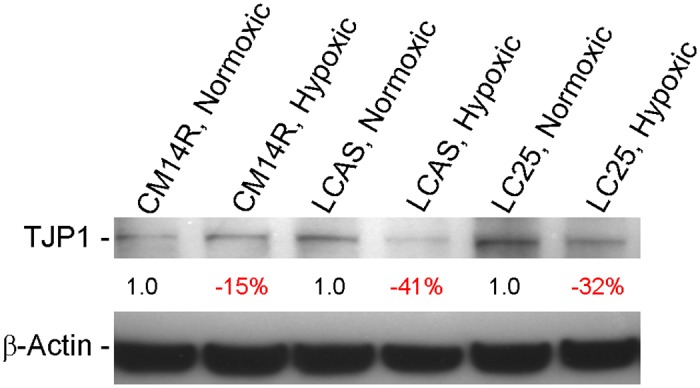
Fig 9. Western blot.

TJP1 protein quantitative difference between the RG cell lines grown for 72 hours in normoxic versus hypoxic conditions. The quantitative differences of TJP1 protein calculated after the correction for actual protein loaded per lane using the β-Actin protein control.
