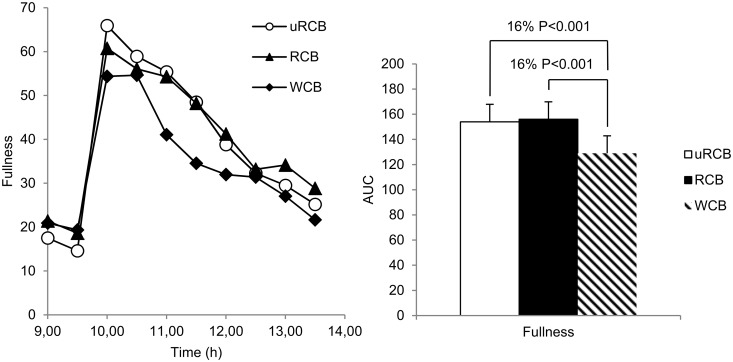
Fig 3. Subjective fullness.
Left: Subjective fullness reported by n = 23 participants. Values are means. A statistically significant difference between treatments was found (P<0.0001). Right: AUC for subjective fullness reported by n = 23 participants. A statistically significant difference between treatments was found (P<0.0001). Values are adjusted least square means (LSM) ± standard errors (SE). Differences between treatments are given as percentage difference between the LSM values for AUC of the treatments. P<0.05 was considered significant.

