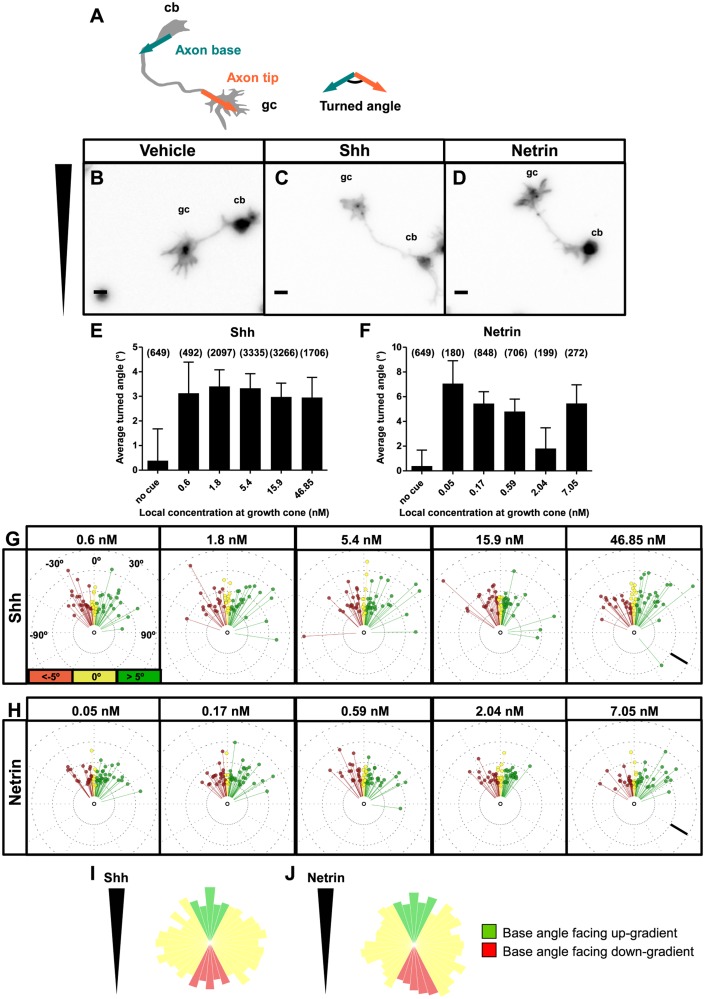
Fig 3. Axons turn up gradients of Shh and Netrin-1 in le Massif.
(A) The turned angle is defined as the angle between the line representing the proximal 20 μm of the axon at the cell body (axon base, turquoise) and the line representing the distal 20 μm of the axon at the growth cone (axon tip, red). The sign of the turned angle is positive if the turn is in the direction of the higher concentration of chemoattractant, and the sign of the turned angle is negative if the turn is in the direction of the lower concentration. (B,D) Images of commissural neurons grown for 1 d in culture followed by the application of (B) control vehicle gradient (BSA), (C) Shh gradient or (D) Netrin-1 gradient for 24 h. Wedge represents the gradient orientation. The average turned angles of axons as a function of the absolute concentration of (E) Shh and (F) Netrin-1 at the growth cone. Axons turn to a similar extent over a wide range of concentrations. The number of axons in each group is indicated in parentheses. (G,H) Circular distribution of individual turned angles. The angular deviation from vertical represents the magnitude of the turned angle, such that points to the right of the center are attracted (green) and those to the left are repelled (red). Neurons which turned between -5° and 5° are considered to be neutral (yellow). The distance of each point from the center represents the axon length. A random sample of 60 axons for Shh and Netrin-1 are plotted. A small shift in distribution towards attraction is seen across a wide range of concentrations for either cue. (I,J) To exclude the possibility that the gradients influence the angle at which the axon protrudes from the cell body, a gradient was applied 6 h following plating the neurons, before most neurons had initiated an axon. Axon base angle frequency distributions for axons grown in (I) Shh and (J) Netrin-1 were measured. Green bars represent the number of axons with a base angle facing up-gradient, and red bars indicate axons with angles facing down-gradient. There is no significant bias in angle distribution for either cue (Rayleigh test for uniformity, Shh: n = 2,028; Netrin: n = 2,805). Scale bars (B-D): 10 μm. (G,H): 25 μm. Error bars represent SEM. cb, cell body; gc, growth cone. See also S3 Fig.

