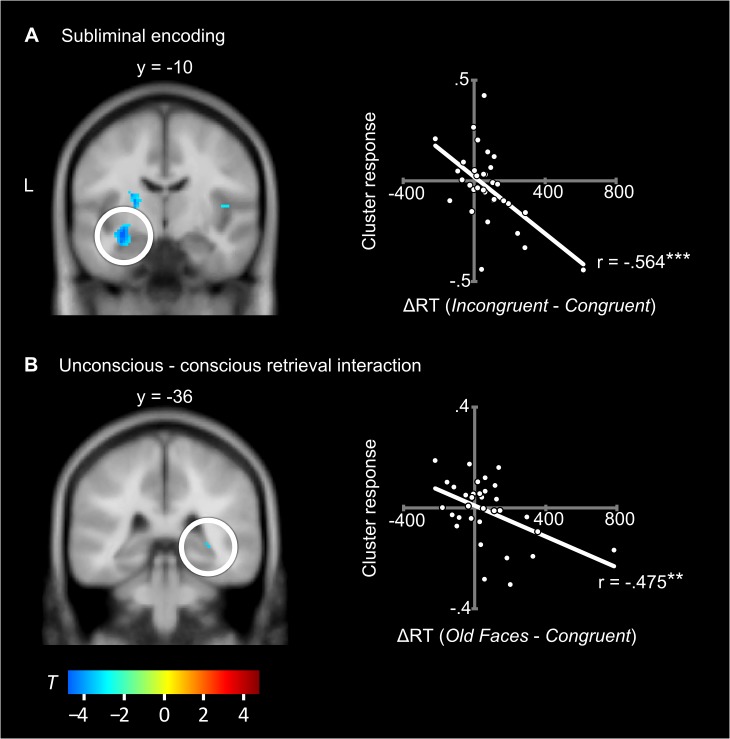
Fig 4. Hippocampal activity relates to retrieval performance.
Locations of significant correlations are displayed on the left side of the figure. The circled hippocampal clusters correspond to the respective scatterplots displayed on the right side of the figure. Pearson-correlation coefficients are included. A: Correlation of the encoding contrast (Face-Occupation Pairs > Faces Alone) with the reaction time difference (ΔRT) between the Incongruent and Congruent condition. B: Correlation of the interaction contrast (Congruent > Old Faces) with the ΔRT between the Congruent and the Old Faces condition. Coordinates are in MNI space; the left side of the image corresponds to the left side of the brain. Warm colours indicate positive correlations (none present), cold colours negative correlations. ** p <. 01, *** p <. 001.

