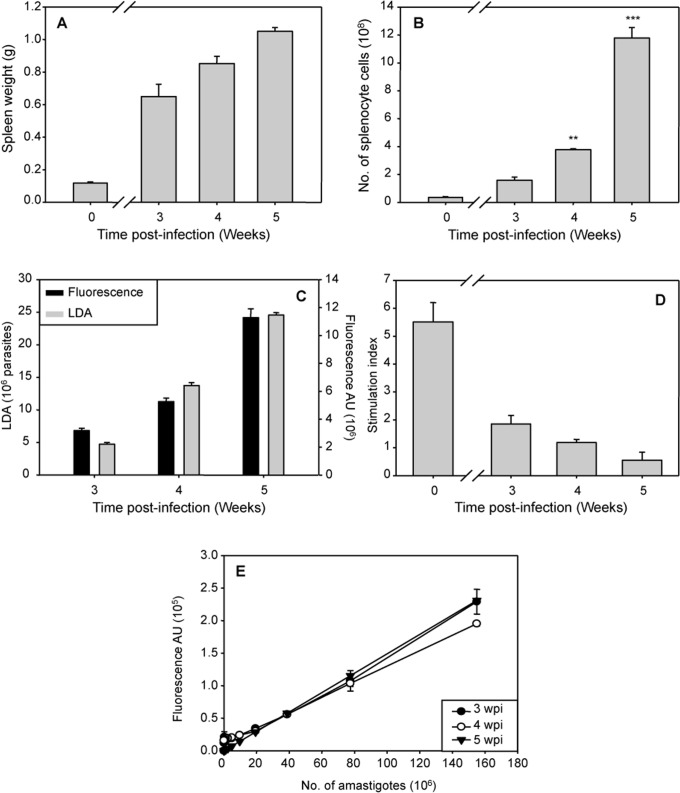
Fig 3. Establishing the appropriate time for ex vivo splenic explant culture.
Mice infected with 107 metacyclic-engineered HSP70+L. infantum strain were evaluated from 21 to 35 days post infection (n = 6 per time point). A) Spleen weight (shown as the mean ± SD). B) Splenocyte number obtained from a single animal was determined by counting the cells by direct microscopy (mean ± SD). C) Splenic parasite burden. Parasitic load expressed as LDAU after ten days of differentiation of amastigotes into promastigotes (left axis). The number of amastigotes (mean ± SD) was determined by fluorescent emission of splenocytes (10 mg of splenic cellular suspension) extrapolating to the standard curve (right axis) D) Splenocyte stimulation index expressed as the ratio ConA-stimulated and non-stimulated splenocytes (shown as the mean ± SD). E) Amastigote standard curve; correlation between fluorescent signal and number of amastigotes counted by microscopy. Significance level *** p< 0,001; ** p<0.01; from two tails of Student t-test.

