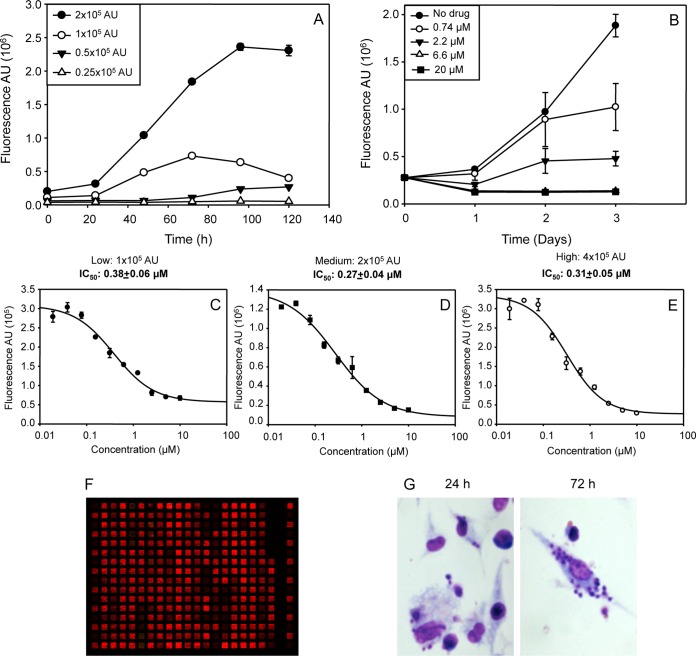
Fig 4. Establishing conditions for using the splenic explant culture as drug screening platform in 384-well plates.
A) Starting cell density-well. Splenocytes were plated at different fluorescent signals (four 2-fold dilutions from 2.0 x 10⁵arbitrary units (AU) and incubated at 37ºC and 5% CO2 for 5 days. Each 24 h the fluorescent signal was read in an Odyssey® infrared imager (LI-COR). B) Effect of AmpB on splenocyte culture. Four 3-fold dilutions from 20 μM AmpB were added to splenic explant cultures at 2.0 x 10⁵ starting density-well. Fluorescence emission was recorded each 24 h during 3 days of incubation. C-E) AmpB dose-response profile. Splenocytes were plated at different starting densities and incubated in presence of ten 2-fold dilutions from 10 μM concentration. Fluorescence signal was recorded for 96 h. IC50 values were calculated after a nonlinear fitting with the SigmaPlot software. F) Infrared fluorescence recording of a representative 384-well plate in the infrared imager Odyssey (LI-COR). G) Giemsa staining of macrophages infected with HSP70+L. infantum 24 and 72 h after culturing. Experiments were carried out by triplicate and error bars represent standard deviations (SD).

