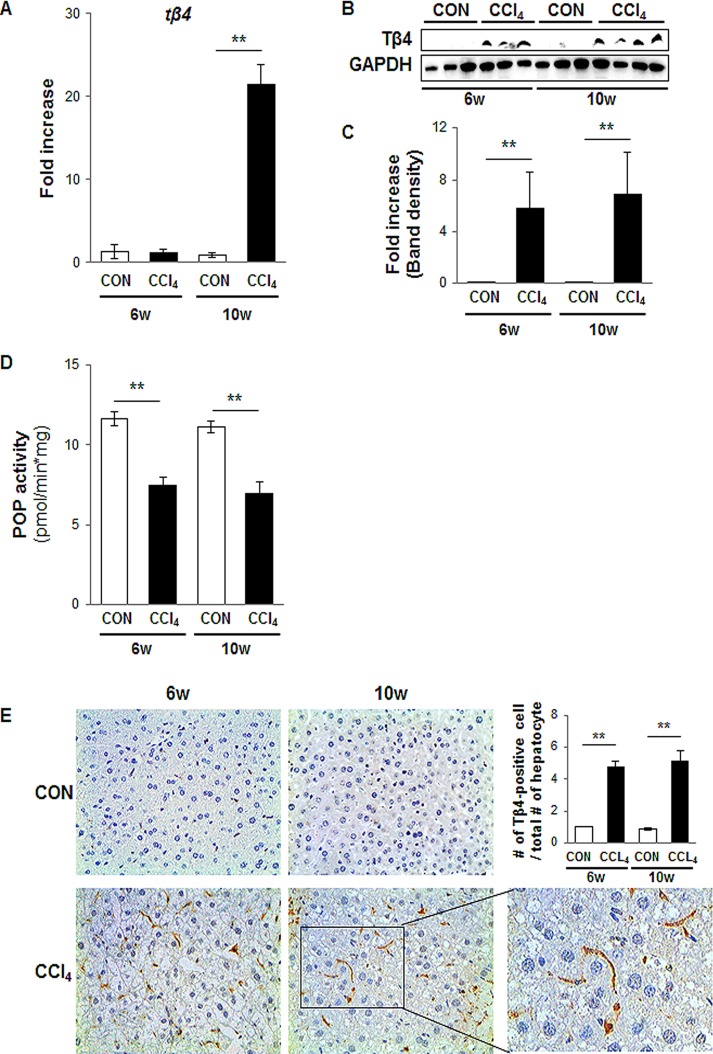
Fig 2. Up-regulation of Tβ4 in the livers from CCl4-treated mice.
(A) QRT-PCR analysis of liver mRNA from CCl4-treated mice for Tβ4 (n = 4 mice / group). Mean±SD results are graphed. (B) and (C) Western blot analysis of Tβ4 (GAPDH was used as an internal control). Data shown represent one of three experiments with similar results. (B: Immunoblot / C: Band density) (n≥3 mice/ group) Data represent the mean±SD of three independent experiments (**p<0.005 vs. own control group). (D) POP activities in homogenates of controls and CCl4-treated mice are presented in picomole of AMC/min x mg tissue. Mean±SD results are graphed and data represent the mean±SD of three independent experiments (**p<0.005 vs. own control group). (E) IHC for Tβ4 in the liver at 6 and 10 weeks post CCl4 injection. Brown color indicated Tβ4-positive cells (X40). Magnified representative images from CCl4-treated livers at 6 and 10 weeks (X63) is shown in right panel. TB4-positive cells were quantified by dividing of the total number of positive cells by the total numbers of hepatocytes per field. Mean±SD results are graphed (**p<0.005 vs. own control group). (CON: corn oil-treated mice, CCl4: CCl4-treated mice).

