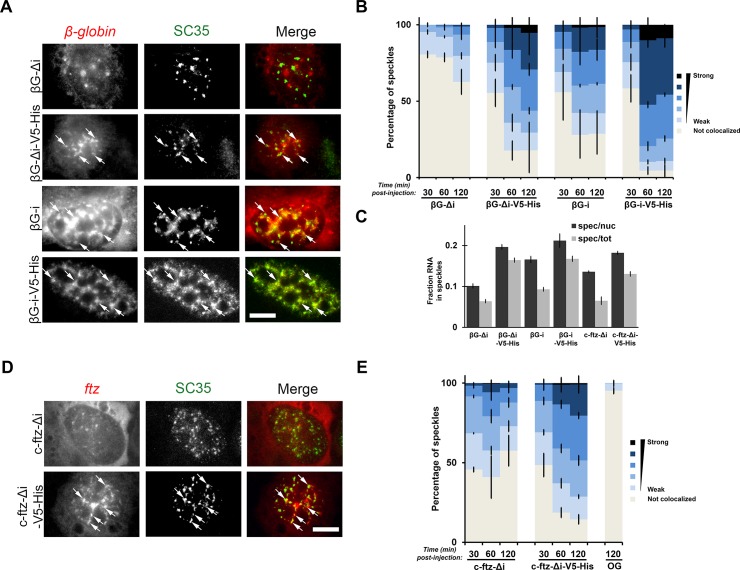
Fig 4. Characterizing the nuclear retained mRNP state.
(A) Plasmids containing the indicated genes were microinjected into nuclei. After 2 hrs, cells were fixed and stained for β-globin mRNA by FISH and SC35 by immunofluorescence. Each row represents a single field of view. The color overlay shows mRNA in red and SC35 in green. Speckles containing mRNA are indicated by0020arrows (Scale bar = 10μm). (B) Microinjected cells were analyzed for the distribution of mRNAs into nuclear speckles. Individual nuclear speckles, as determined by SC35 staining were analyzed for mRNA content by Pearson Correlation Analysis. For details on the analysis please see the methods section. Each bar is the average and standard error of the mean of three experiments, each of which consist of 150–200 speckles analyzed from 15–20 cells. Note that nuclear-speckle association is enhanced by the V5-His element even in the presence of splicing. (C) The amount of various mRNA present in nuclear speckles (as defined by the brightest 10% pixels in the nucleus, using SC35 immunofluorescence—see methods section and Akef et al., 2013 for details) as a percentage of either the total nuclear (“spec/nuc”) or total cellular (“spec/tot”) mRNA level in cells 1 hr post-microinjection. Each data point represents the average and standard error of the mean of 10–20 cells. Note that β-globin-Δi was not enriched in speckles as ~10% of the nuclear RNA fluorescence was present in these regions, which represents 10% of the total nuclear area. (D-E) Similar to (A-B), except that the co-localisation of c-ftz-Δi +/- V5-His RNA with nuclear speckles was analysed. As a control, the colocalization of SC35-positive speckles with microinjected 70kD dextran conjugated to oregon green dye (“OG”) was analyzed.

