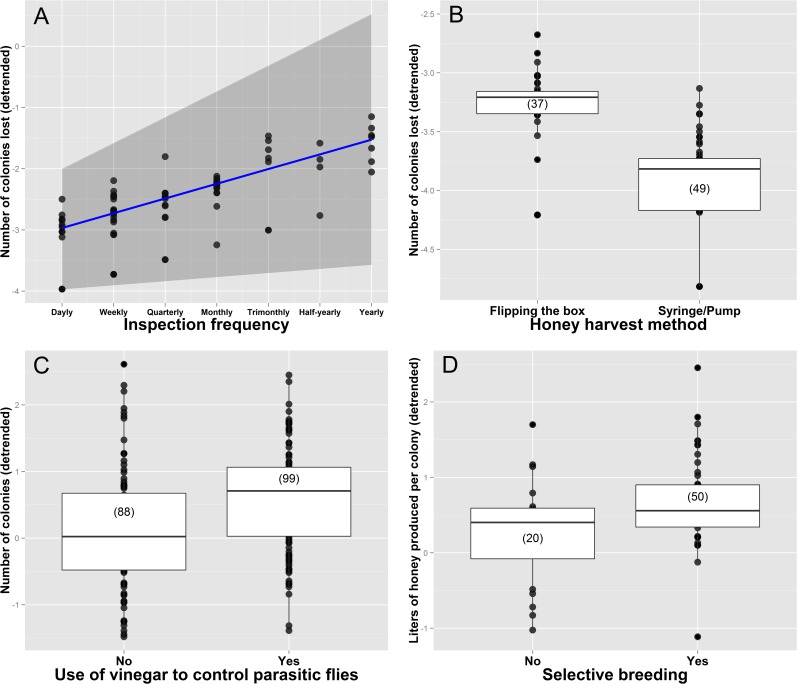
Fig 5. Influence of colony inspection frequency on the number of colonies lost (A), influence of the honey harvest method on the number of colonies lost (B), influence of the use of vinegar on the number of colonies (C), and influence of selective breeding on the liters of honey produced per colony (D).
Response variables are detrended to show the correct relationship between response and particular predictor variables (the effect of the other predictor variables has been subtracted out). In A, the blue line represents the fitted curve while the gray area shows the 95% confidence interval. In B, C and D, median values are represented by the lines inside boxes, which span the first and third quartiles. Dots show all observations outside these quartiles, and sample sizes are provided in brackets.

